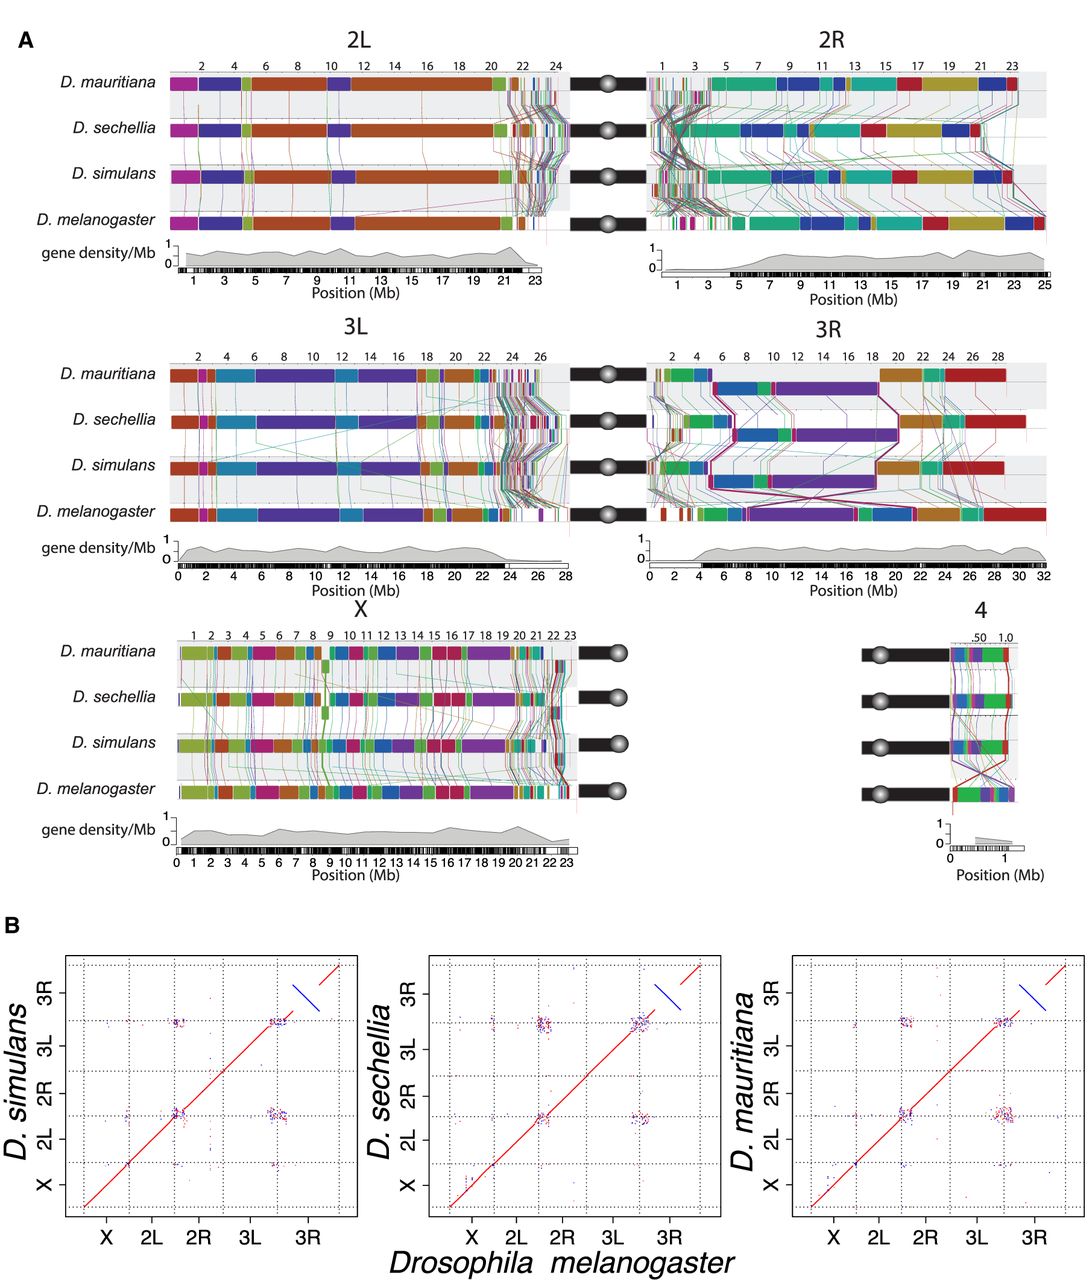
Chromosomal rearrangements in the sim-complex species. We used Mauve (A) and minimap2 (B) (Li 2018) to show synteny between the members of the sim-complex and D. melanogaster. (A) Colored rectangles show positions of syntenic collinear blocks free from internal rearrangements compared with the D. melanogaster reference (r6; see details in Methods). Each chromosome arm is plotted with its own scale, with the position in megabases indicated above each chromosome. Blocks that appear below the black line are in an inverse orientation. Lines connect homologous colored blocks between genomes, and crossing lines indicate structural rearrangements. Along the euchromatic chromosome arms, there are three major inversion events (X, 3R, and 4). The heterochromatic regions have significantly more rearrangements than the euchromatin (see text). Pericentromeric heterochromatic regions are marked with a solid black bar, and the circles correspond to centromeres. (B) The dot plots for the whole genome and each chromosome arm between the sim-complex species and D. melanogaster.