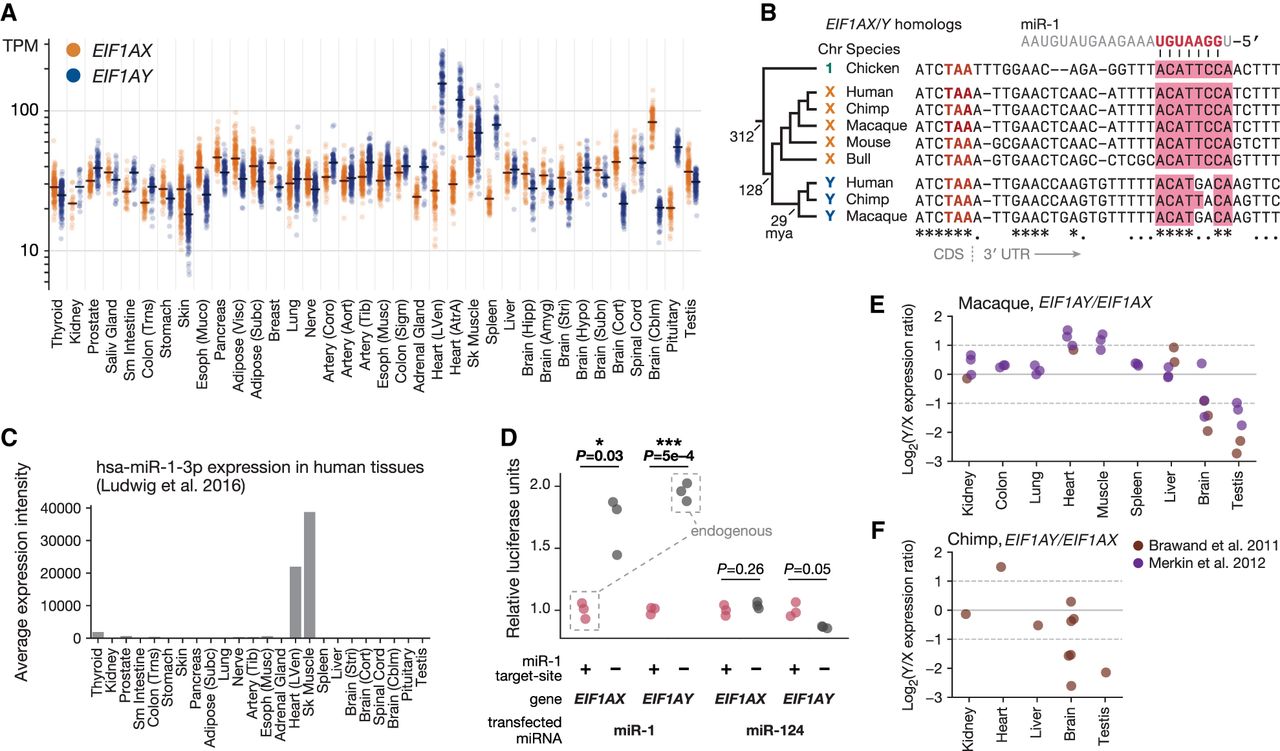
Y-specific loss of the miR-1 target site led to elevated EIF1AY expression in XY heart and tissue. (A) Each point shows expression level of EIF1AY (blue) or EIF1AX (gold) in a single tissue sample from an XY individual. Lines show median expression level. (B) Alignment of 3′ UTRs of EIF1AY, EIF1AX, and their orthologs; miR-1 target site in pink. Key branch points annotated with estimated divergence times in millions of years ago (mya). Fully conserved sites annotated with an asterisk; sites consistent with a single evolutionary substitution event annotated with a dot. (C) Quantile-normalized expression levels of miR-1 across human tissues. (D) Activity of luciferase reporter fused to 3′ UTR sequences of EIF1AX or EIF1AY with intact (+) or disrupted (−) miR-1 site in HEK293 cells, upon transfection with miR-1 or miR-124. Luciferase activity of each reporter with a disrupted miR-1 site is normalized to activity of corresponding reporter with intact site. P-values from two-sided Welch's t-test. (E,F) Each point shows Log2(Y/X expression ratio) for EIF1AY/EIF1AX orthologs in macaque (E) and chimpanzee (F).