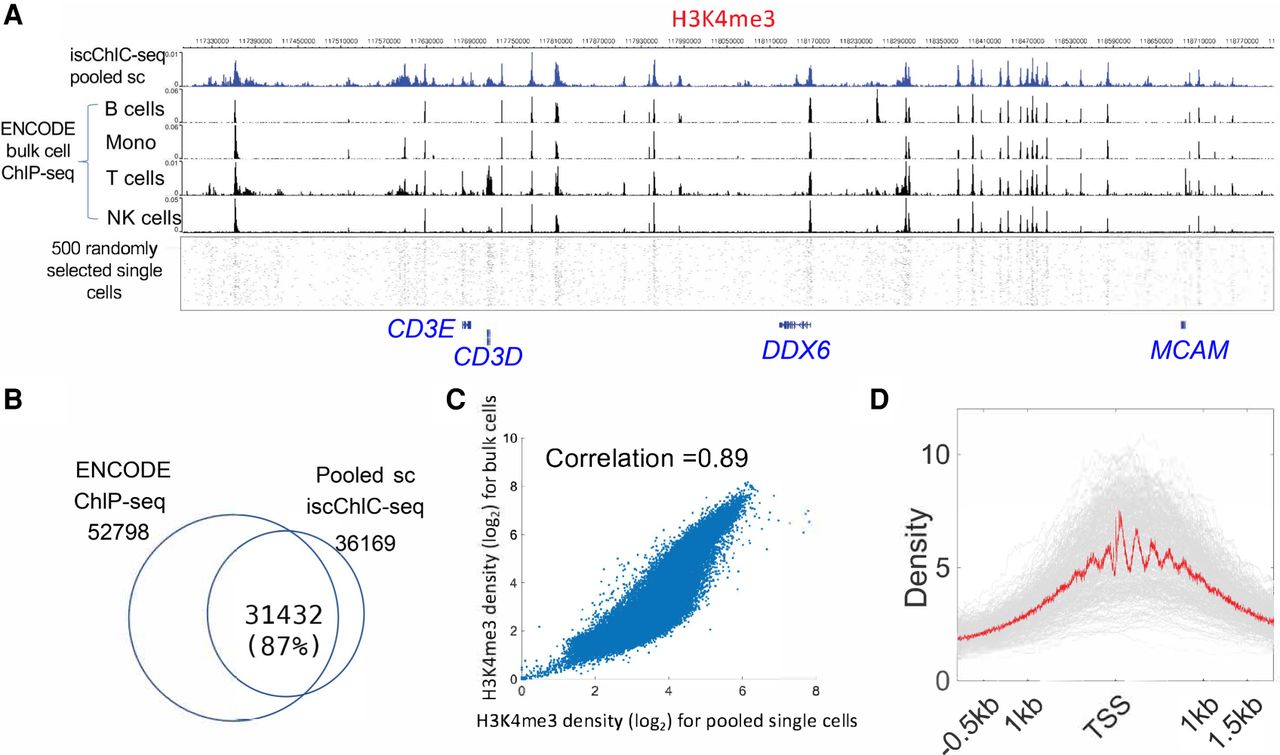
iscChIC-seq robustly detects H3K4me3 profiles in human white blood cells. (A) A genome browser snapshot showing panels of H3K4me3 profiles in human white blood cells. The top blue track shows the pooled single-cell data from iscChIC-seq. The bottom track shows 500 randomly selected single cells. The middle tracks display the ENCODE bulk cell ChIP-seq data from different cells indicated on the left. (B) A Venn diagram showing the overlap of the enriched regions (peaks) of H3K4me3 profiles measured by ChIP-seq using bulk cells and by the pooled single-cell data. (C) A scatterplot of the H3K4me3 read density of ChIP-seq (bulk-cell) versus that of pooled single cells from iscChIC-seq (2000 cells were randomly selected) at the genome-wide divided bins (the size of the bin is 5 kb). The Pearson's correlation is equal to 0.89. (D) A TSS profile plot showing the H3K4me3 profile around TSSs for all single cells (gray) and the pooled single cells (red).