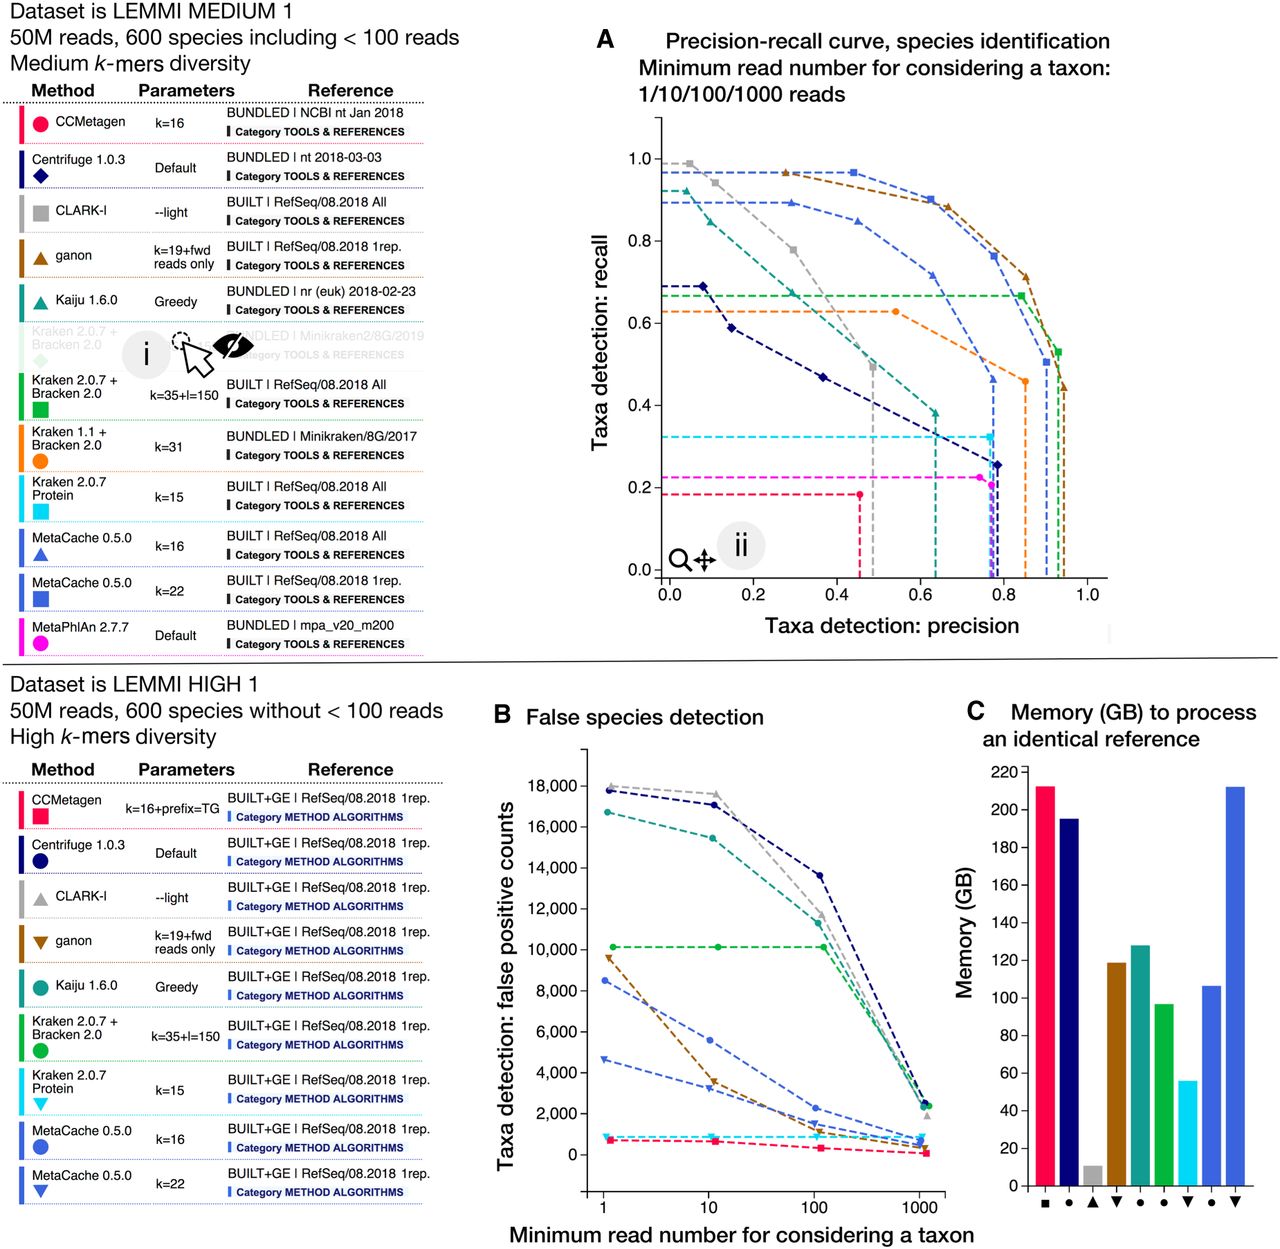
“Detailed plots by data sets” interface. Plots for up to 17 metrics are available for each data set, and the LEMMI user can toggle each line representing a method associated with a reference and specific parameters individually (i). Plots can be zoomed in to disentangle overlapping points and permit focused interpretations (ii). The pages exist for all taxonomic ranks investigated, that is, genus and species in the release beta01. (A) The precision-recall curve in species identification, when filtering to only consider taxa represented by an increasing minimum of reads. If a curve contains fewer than four independent points (precision-recall at minimum 1/10/100/1000 reads), it indicates that filtering did not change the precision and recall at all thresholds, leading to overlaps. The entries are a mix of methods using references freely provided or built using the current maximal memory capacity of LEMMI of 245 GB. B and C show results when assessing methods using an identical built reference. (B) Illustration showing how LEMMI assesses the precision improvement enabled by filtering low abundance taxa at different thresholds. (C) Reporting the peak of memory necessary to construct the reference.