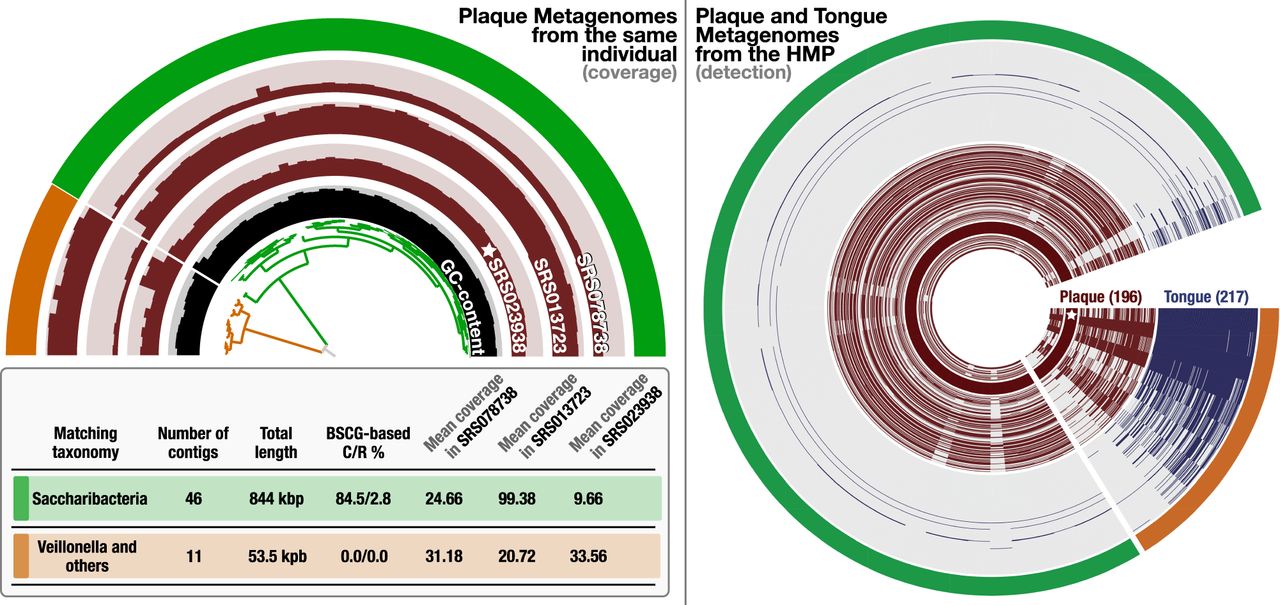
Contamination in MAG without extra copies of SCGs. In the left panel, the half-circle displays the mean coverage of each contig in Pasolli MAG across three plaque metagenomes that belong to the same individual, for which the “star” symbol denotes the sample from which the original MAG was reconstructed. The dendrogram in the center represents the hierarchical clustering of the 57 contigs based on their sequence composition and differential mean coverage across the three metagenomes, and the innermost circle displays the GC content for each contig. The outermost circle marks two clusters: one with 46 contigs (green) and another one with 11 contigs (orange). The table underneath this display summarizes various statistics about these two clusters, including the best matching taxonomy, total length, completion and redundancy (C/R) estimations based on SCGs, and the average mean coverage of each cluster across metagenomes. In the right panel, the distribution of the same contigs and clusters are shown across 196 plaque (brown) and 217 tongue (blue) metagenomes generated by the Human Microbiome Project (HMP). Each concentric circle in this display represents a single metagenome, and data points display the detection of the contigs in Pasolli MAG.