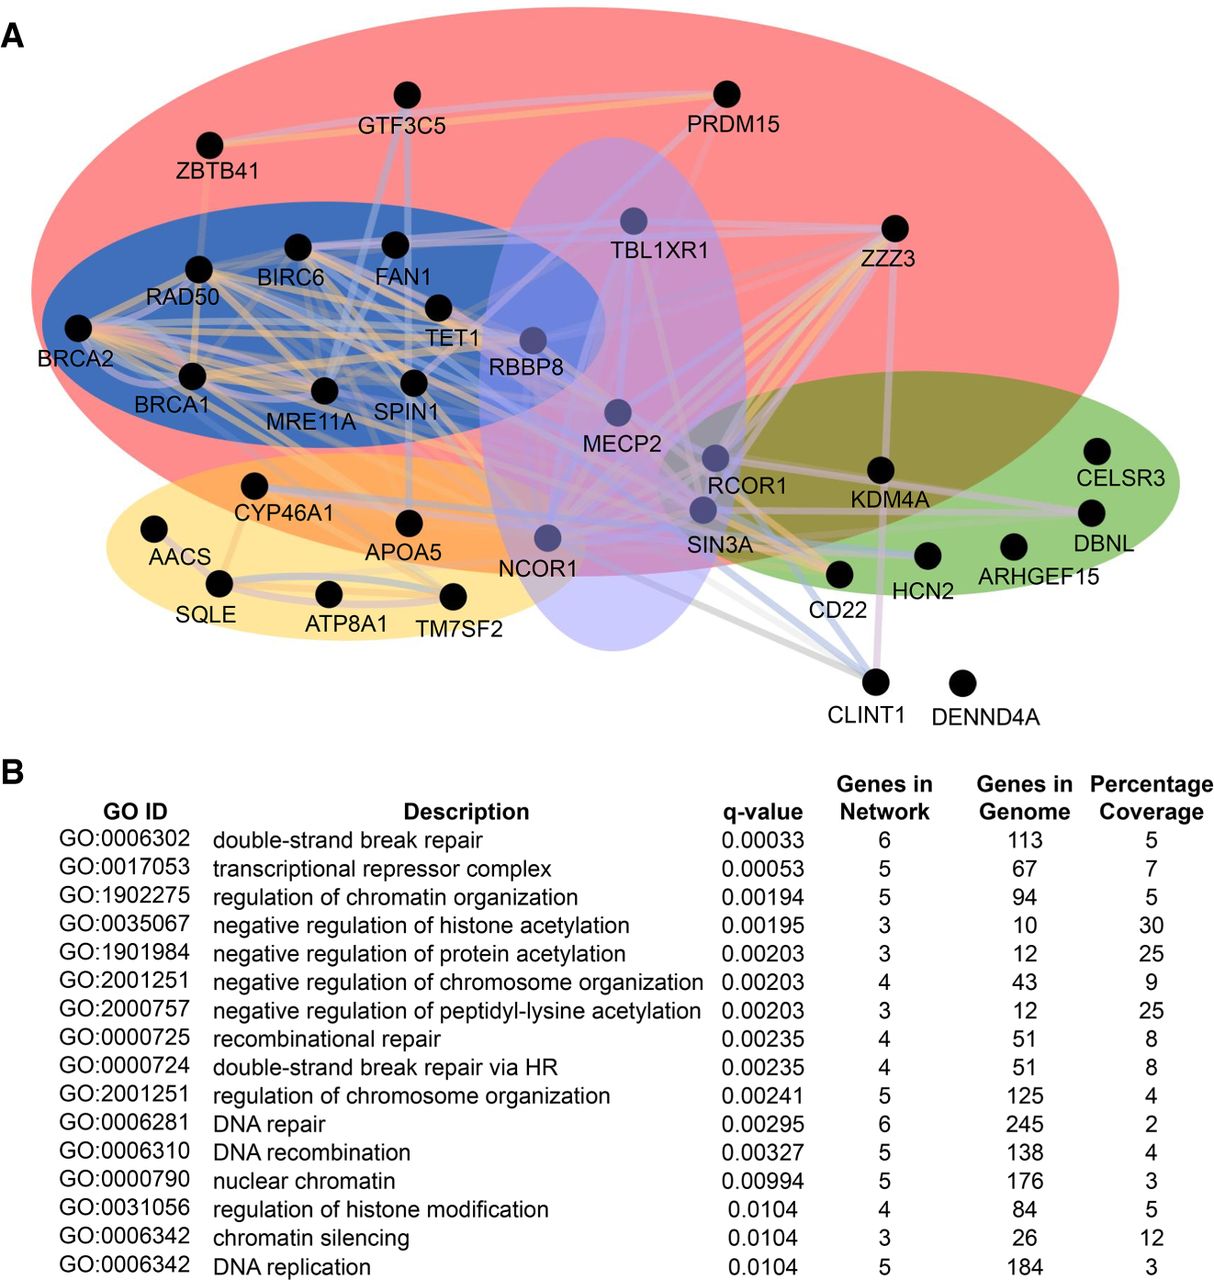
A functional network analysis of proteins encoded by candidate genes. (A) A network enrichment map showing the relationships between proteins with supported or pathway lesions. Proteins are represented as black dots or nodes, and the relationships between them are represented as colored lines or edges, in which purple lines denote coexpression, pink lines denote physical interactions, orange lines denote predicted interactions, blue lines denote colocalization, and green lines denote shared protein domains. Further clustering (indicated by colored ovals) revealed that most of the proteins group into the broad categories of lipid metabolism and homeostasis (yellow), synaptic function (green), and DNA damage response (blue). Several proteins are also involved in transcriptional repression (purple). Sixty-three percent are included in the broad category regulation of DNA activity (pink). (B) The most enriched Gene Ontology (GO) terms in this network, as determined by their false discovery rate (FDR)-adjusted q-value, are double-strand break repair, transcriptional repressor complex, negative regulation of histone acetylation, and regulation of chromatin organization. The percentage coverage indicates the proportion of genes within a given GO ID that are also present in the network.