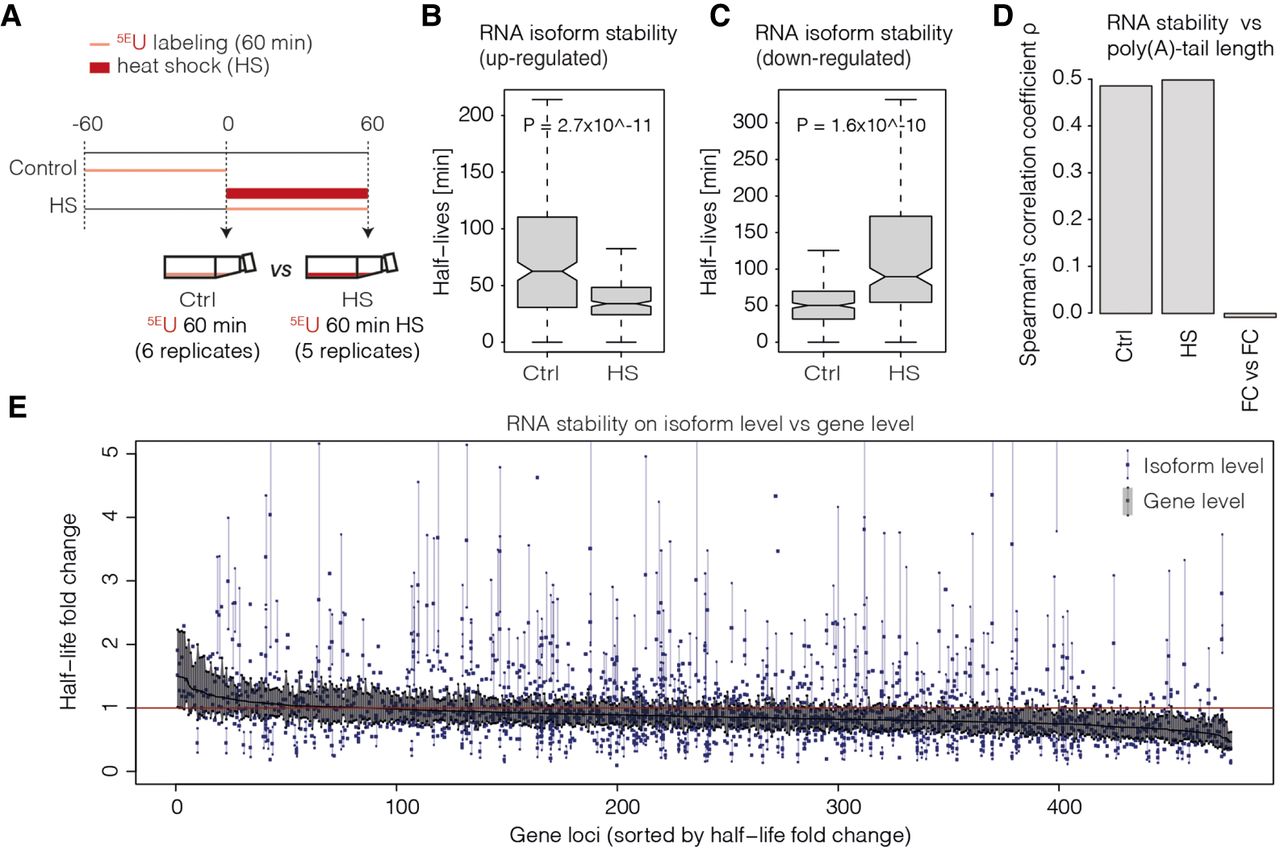
Nano-ID monitors RNA isoform dynamics during heat shock (HS). (A) Experimental set-up of the HS treatment (60 min at 42°C) in human K562 cells. 5EU labeling was performed for 60 min. (B) Box plot showing half-lives (min) of significantly up-regulated RNA isoforms in HS (5EU 60 min HS) against control samples (5EU 60 min). (C) As in B for significantly down-regulated RNA isoforms. (D) Bar plot showing correlation (Spearman's rank correlation coefficient ρ) of RNA half-lives and poly(A)-tail lengths before and after HS (1310 loci). The third bar shows the correlation of RNA half-life fold change upon HS and poly(A)-tail length fold change upon HS. (E) Half-life fold changes upon HS (y-axis) depicted for individual RNA isoforms alongside the half-life fold change derived from combined RNA (gene level; all RNAs encoded by the entire gene loci regardless of isoform assignment). Shown are 478 high-confident loci (x-axis). All estimates are supported across biological replicates (n ≥ 5) and conditions (HS; control). Half-life estimates for combined RNA (gene level) are depicted as a black line (sorted in decreasing order). Blue dots represent individual RNA isoform half-life estimates (1988 isoforms in total). All RNA isoform half-life estimates as well as one respective combined RNA half-life estimate (in black) sharing a common x-axis coordinate belong to the same gene loci. Vertical blue and black lines represent standard deviations of individual estimates. For individual RNA isoform half-life estimates, standard deviations are only shown if not overlapping with the standard deviation of the respective combined half-life estimates (black).