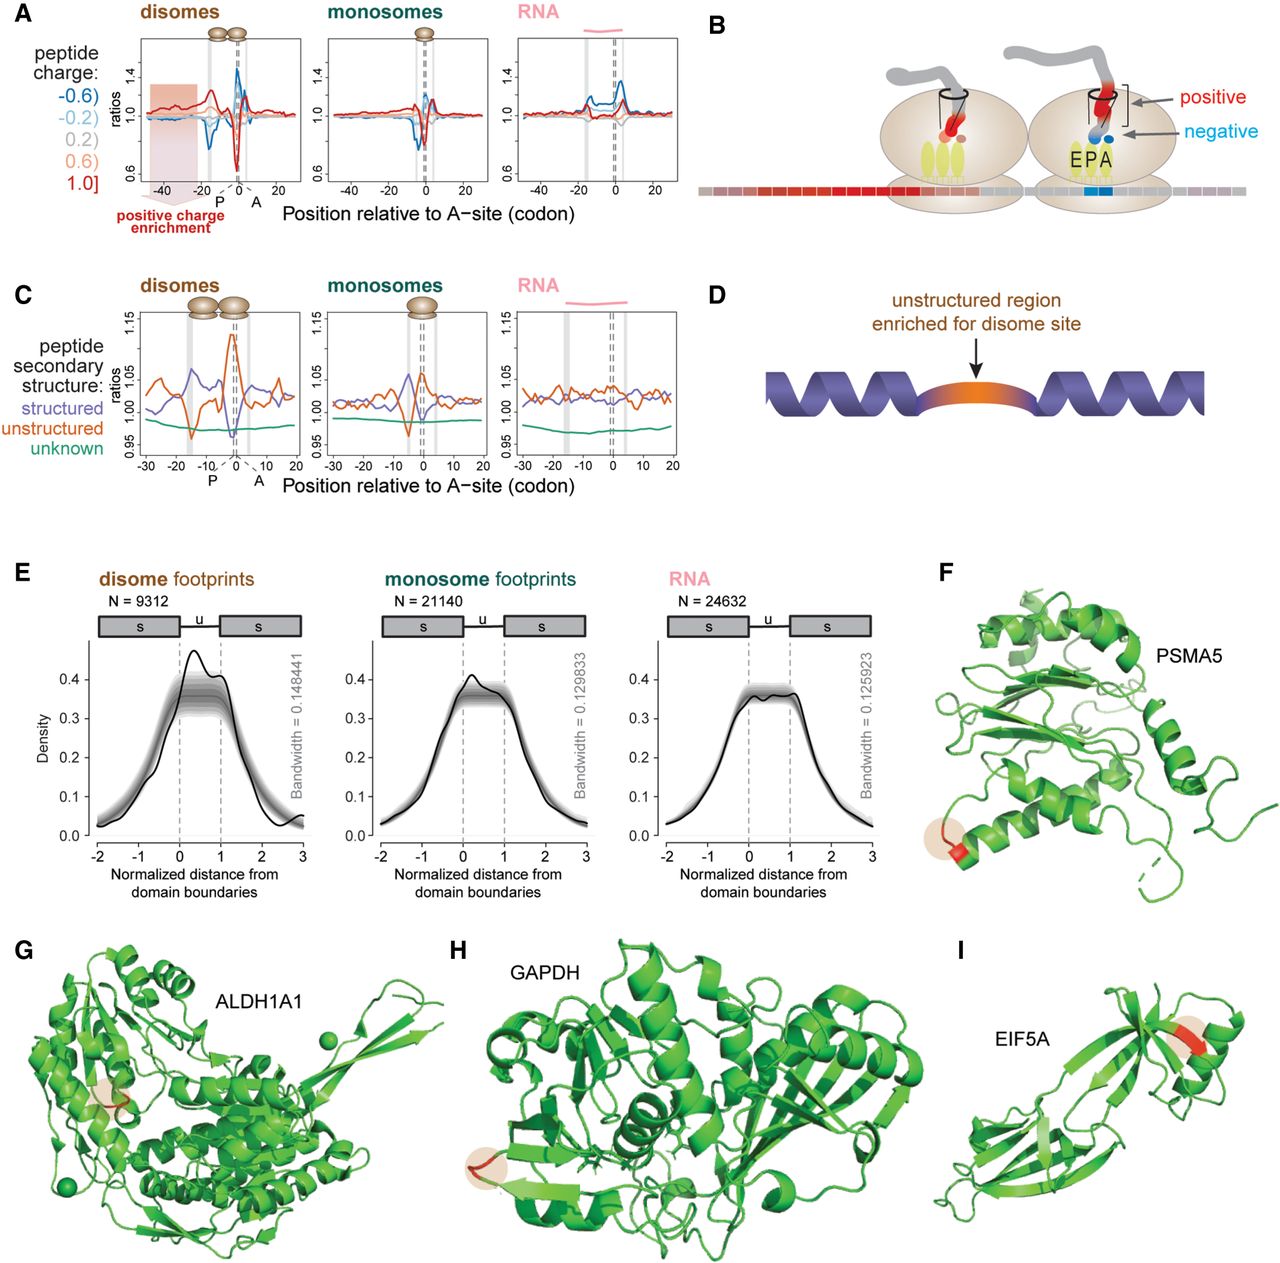
Disome site positions are related to nascent polypeptide charge and secondary structure. (A) Position-specific enrichment analysis reveals association with positive charge in the nascent polypeptide. Average charge of three consecutive amino acids was stratified into five charge groups (interval boundaries and color codes on the left). Normalized ratios of observed-to-expected occurrences (y-axis, log-scaled) of charge groups were plotted at the center position of the tripeptide relative to the estimated A-site (0 at x-axis) of the leading ribosome (disomes, left panel), or of the individual ribosome (monosomes, middle). RNA is shown in the right panel. The red shaded area in the disome panel (left) marks the extended stretch of positive charge upstream of pause sites. See Figure 3A for general plotting features. (B) Schematic of the electrostatic interactions between the leading ribosome and the nascent peptide chain. Associations of negatively charged residues (blue) with the P- and A-sites and a stretch of positively charged residues (red) within the exit tunnel is depicted. (C) Association between disome sites and the nascent polypeptide structure. Based on the UniProt structural annotation, each position of translated peptides was labeled “structured” for α-helix or β-sheet, “unstructured”, or “unknown”; β-turns were excluded. See Figure 3A for general plotting features. (D) Schematic depicting a preference for pausing during the translation of unstructured polypeptide stretches (orange) that are preceded and followed by structured regions (purple). (E) Enrichment of disome sites within the unstructured stretches of polypeptides that are preceded and followed by structured regions. Structured (min. 3 aa, up to 30th position) - unstructured (min. 6, max. 30 aa) - structured (min. 3 aa, up to 30th position) regions were identified transcriptome-wide. Positions across regions were scaled to the length of the unstructured region and aligned to its start, such that start and end of the unstructured region would correspond to 0 and 1, respectively (x-axis). Kernel density estimates (thick black lines) were calculated for peaks across normalized positions weighted with their normalized counts, estimated at the A-site of the leading ribosome for disomes (left), A-site of the monosomes (center), or center of total RNA reads (right). The density lines drop naturally towards the extremities, as the data matrices were normalized and aligned to the unstructured region and lower numbers of data points are expected to be observed at increasing distance from the boundaries. Confidence intervals for the kernel densities, which were calculated by randomly shuffling (N = 10,000) peaks within each transcript, are shown by gray shaded regions (and allow estimating statistical significance of the signal): darkest at the center, 50% (median) to outward, 25%, 12.5%, 5%, 2.5%, and 1%. (F–I) Three-dimensional structures of proteins with disome site amino acids highlighted. Human PSMA5 (PDB ID: 5VFT) (F); human ALDH1A1 (4WJ9) (G); human GAPDH (4WNC), corresponding residues at aa 65–66 (H); murine EIF5A (5DLQ) (I). The positions of the strongest disome sites are shown in red.