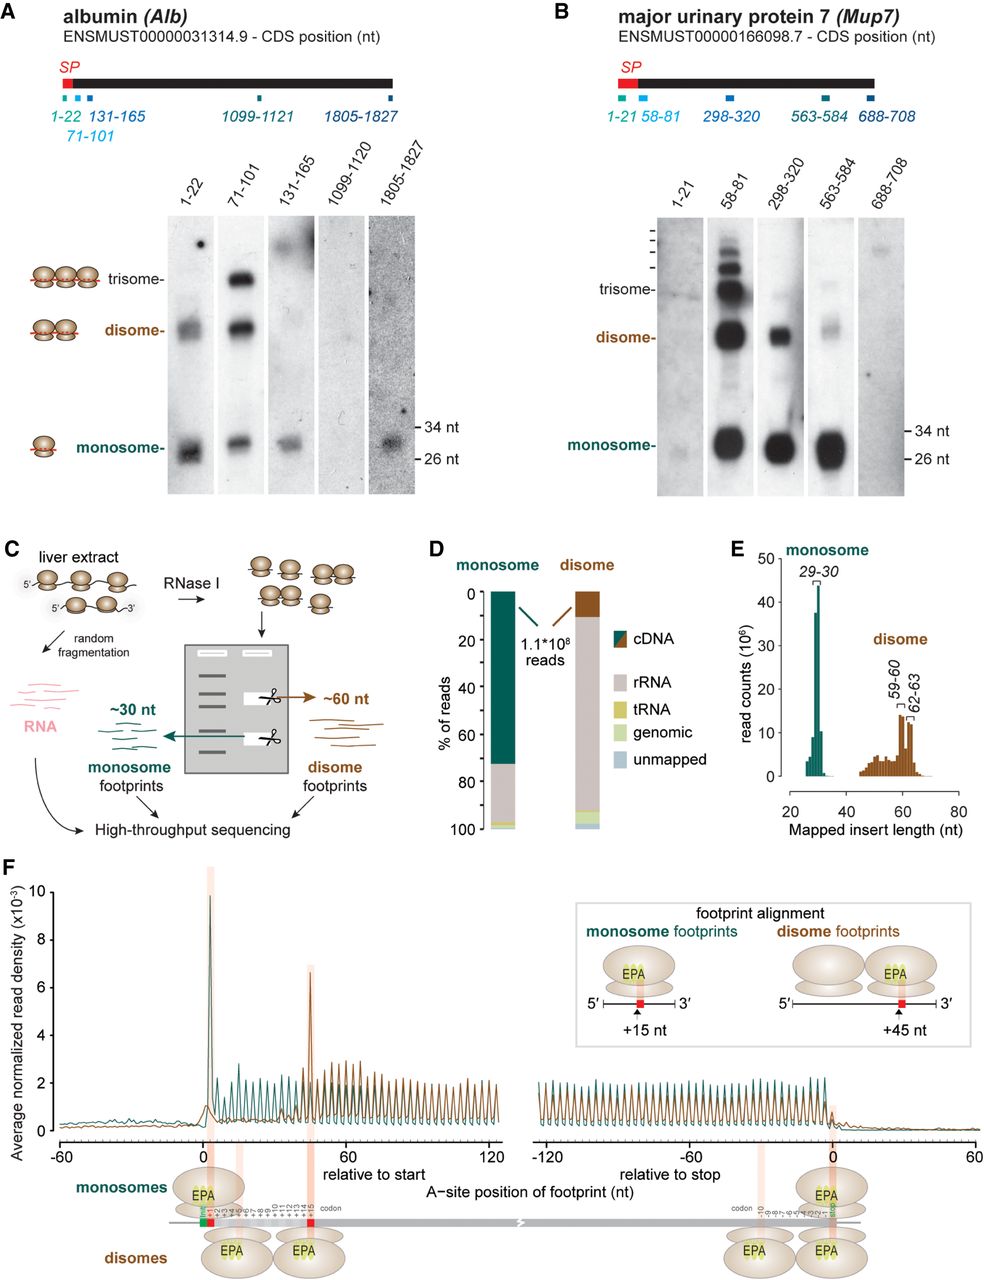
Sequencing of disome footprints identifies transcriptome-wide ribosomal collisions. (A,B) Northern blot analysis of RNase I-treated mouse liver extracts using probes antisense to Alb (A) and Mup7 mRNA (B). Expected footprint sizes for monosomes, disomes, and trisomes are shown to the left of blots. Positions of probes (nt) relative to the annotated CDS start sites on the indicated transcripts are shown above each lane and depicted as blue boxes below the CDS (black bar). The CDS region encoding the signal peptide (SP) is marked in red. (C) Schematic of experimental setup for sequencing of ∼60-nt disome footprints. (D) Proportion of reads from monosome and disome libraries that mapped to different sequence types: rRNA (gray), tRNA (golden), genomic (green), and cDNA/mRNA (teal for monosomes and brick red for disomes). Percentages of unmapped reads are shown in blue. (E) Histogram of insert size (nt) for reads that mapped to cDNA/mRNA sequences (monosomes: teal, disomes: brick red). A single mode for monosomes (29–30 nt) and two modes for disomes (59–60 and 62–63 nt) are labeled above histograms. (F) Density distribution of footprint reads within 120 nt from the start or −120 nt from the stop codons reveals 3-nt periodicity of footprints within coding sequences. The metatranscript analysis quantified the mean of per-transcript normalized number of reads (monosomes: teal, disomes: brick red) at each nucleotide based on the A-site prediction (15 nt and 45 nt downstream of the 5′ end of monosome and disome footprints, respectively). Transcripts from single protein isoform genes with total RNA-RPKM > 5, CDS > 400 nt, and UTRs of >180 nt (N = 4994) were used. The predicted E-, P-, and A-sites of ribosomes that presumably protected the corresponding footprints are shown in graphical depictions. Start/stop codons are highlighted (green) on a representative transcript below.