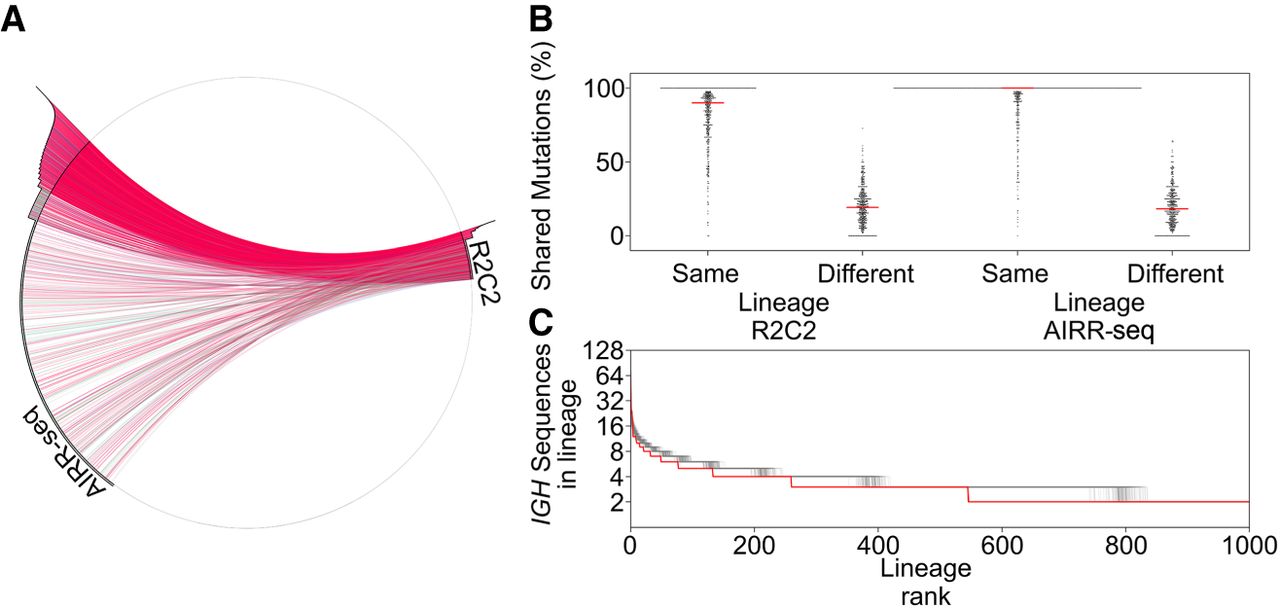
Clonal lineages can be measured by R2C2-based repertoires. (A) Lineages shared between AIRR-seq and R2C2-based repertoires are indicated by connections within a circular plot. Abundance of each lineage within each repertoire is shown as a histogram on the outside of the circle. Color of connecting lines and histogram bars indicates the isotype of a lineage: (red) IGHA; (black) IGHM; (blue) IGHG; (green) IGHD. (B) The distribution of the percentage of mutations in an IGH sequence being shared with IGH sequences within the same or different lineages is shown as swarm plots for R2C2-based and AIRR-seq repertoires. (C) The size of lineages ordered by rank is shown for the R2C2-based repertoire (red) and 100 repertoires subsampled from the AIRR-seq repertoire to match the R2C2-based repertoires depth (gray).