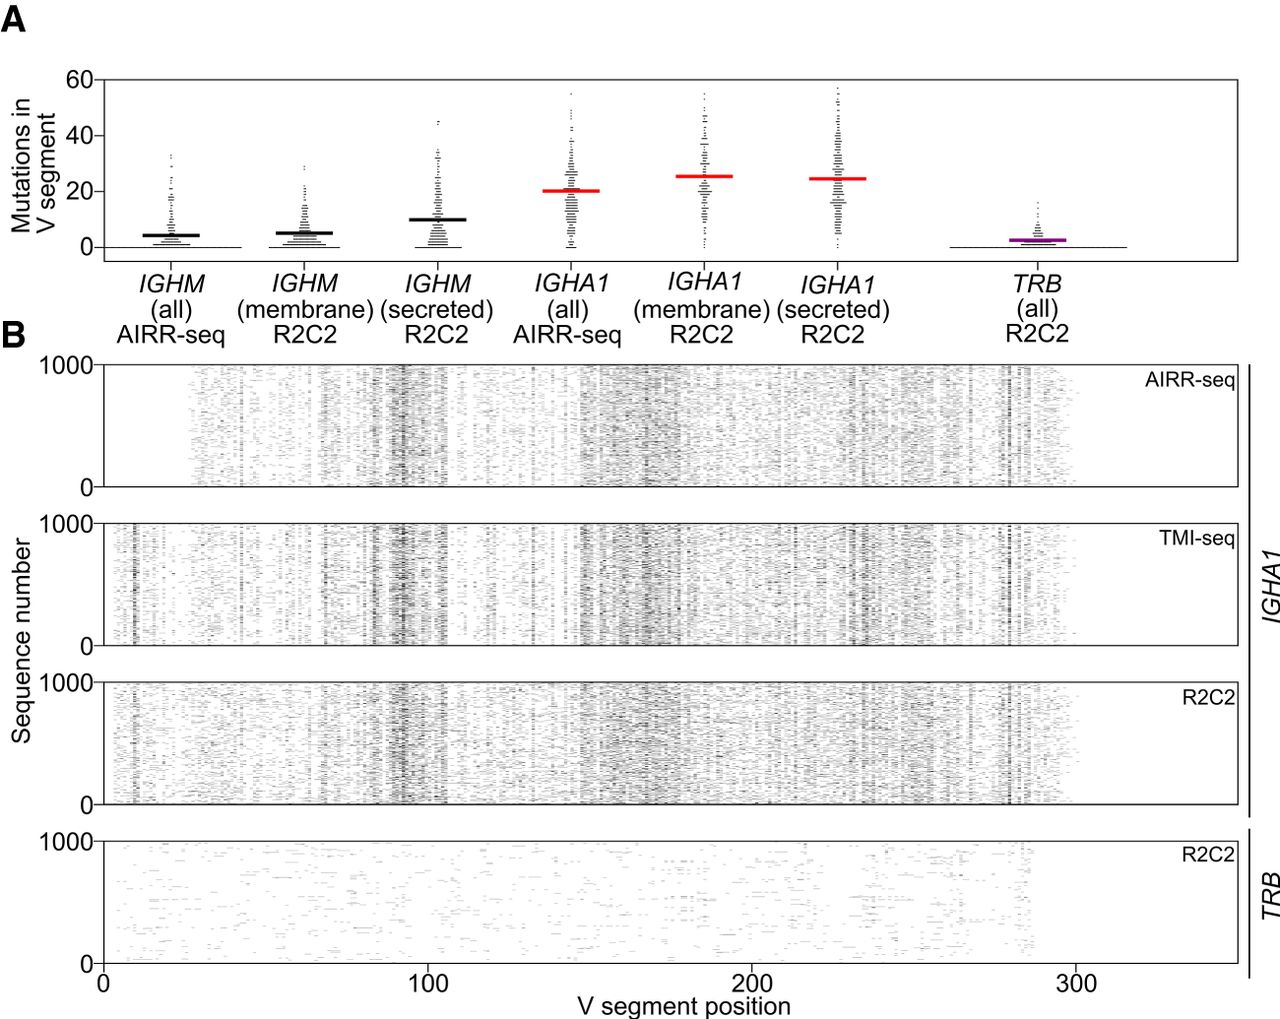
Figure 5.
Somatic hypermutation can be characterized within R2C2-based IGH repertoires. (A) Mismatch mutations per IGH sequence as determined by IgBLAST are shown as swarm plots separated by isotype (IGHM, IGHA1), isoform (membrane-bound, secreted), and technology (R2C2, AIRR-seq) and compared to TRB sequences. Averages are indicated by colored lines. (B) The pattern of mutation locations in V segments in AIRR-seq, TMI-seq, and R2C2 sequences is shown for 1000 randomly sampled IGHA1 or TRB sequences.