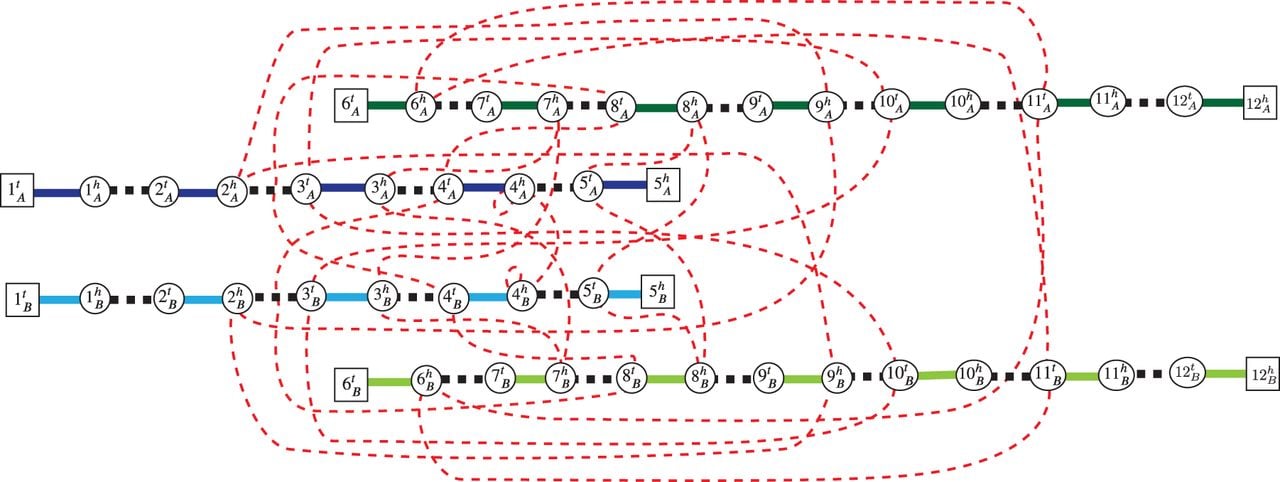
Figure 8.
A DIAG constructed on a set of segments, and a set of adjacencies. The set corresponds to reference adjacencies in a diploid reference R shown in Figure 6B, and the set represents unlabeled novel adjacencies that were measured from a derived genome G shown in Figure 6C. Squares indicate telomere vertices , and circles are non-telomere vertices. Solid edges correspond to segment edges in ES, with dark blue/green edges corresponding to segments labeled A, and light blue/green edges corresponding to segments labeled B. Black-dashed edges are reference adjacency edges ER, and red-dotted edges are novel adjacency edges EN.