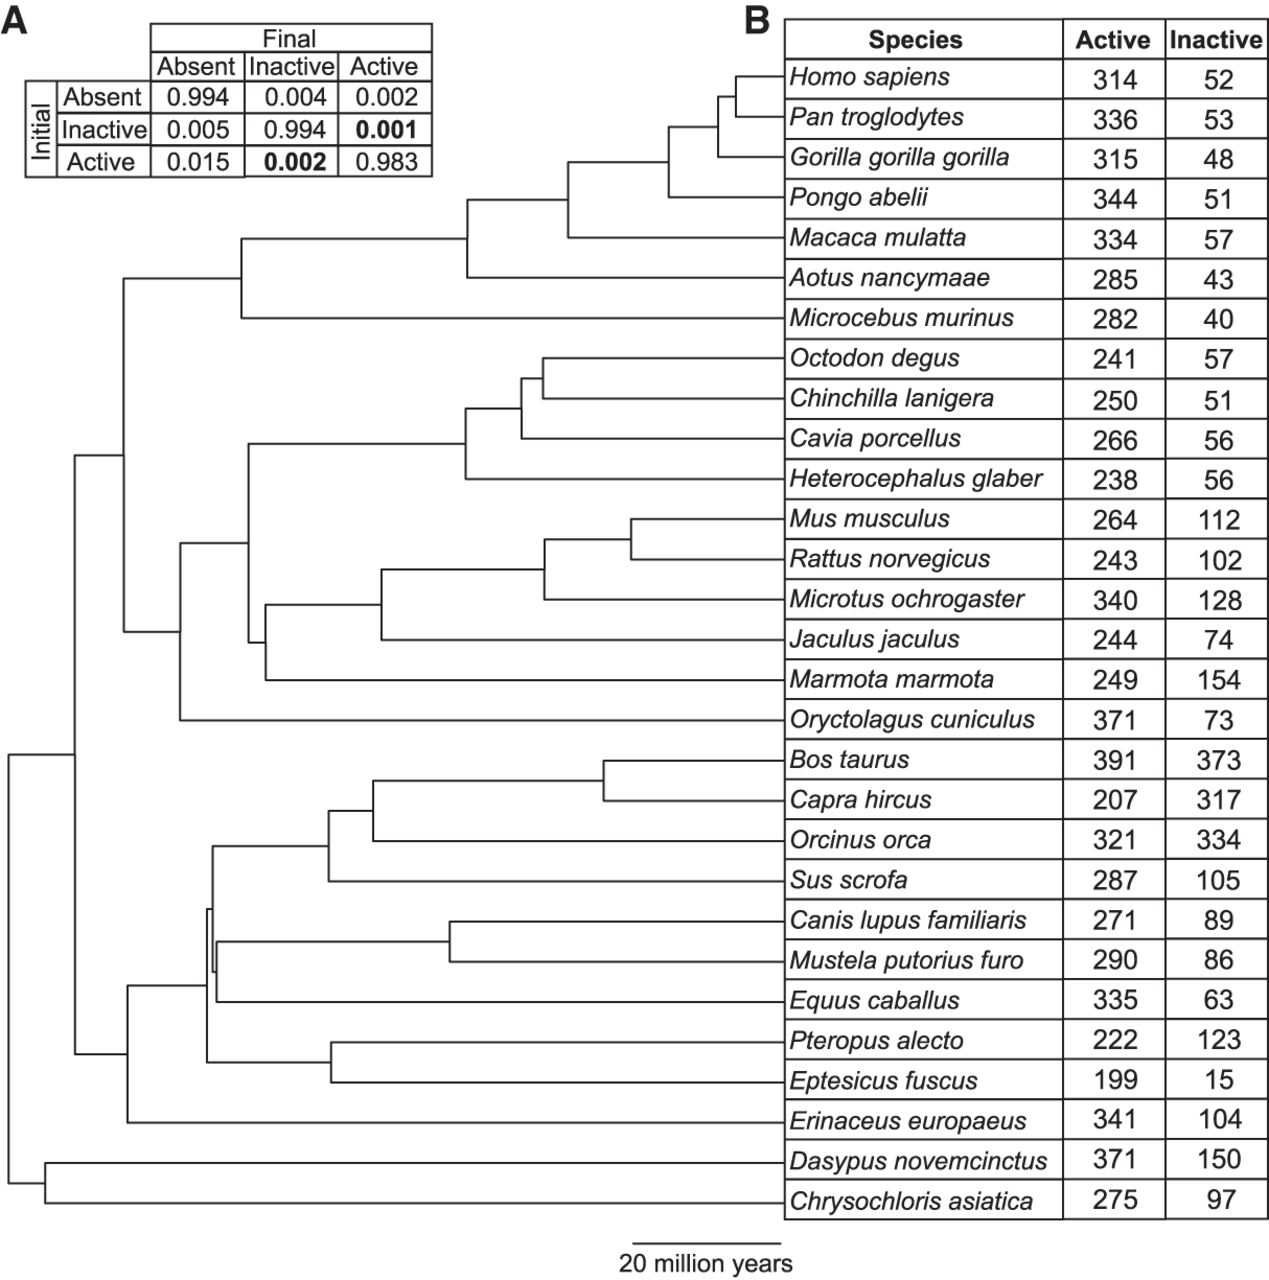
Figure 4.
Placental mammals show consistent distributions of predicted active and inactive tRNA genes. (A) Estimated transition probabilities between each predicted activity state over a branch length of 1 million years using RevBayes. The probabilities of transition from inactive to active (0.001) and from active to inactive (0.002) are in bold. (B) The number of tRNA genes in each predicted activity class are shown for each species in our phylogeny (Hedges et al. 2006), after removal of tRNA genes in segmental duplications. For human and mouse, tRNA genes with no epigenomic data are also excluded from this table (Methods).