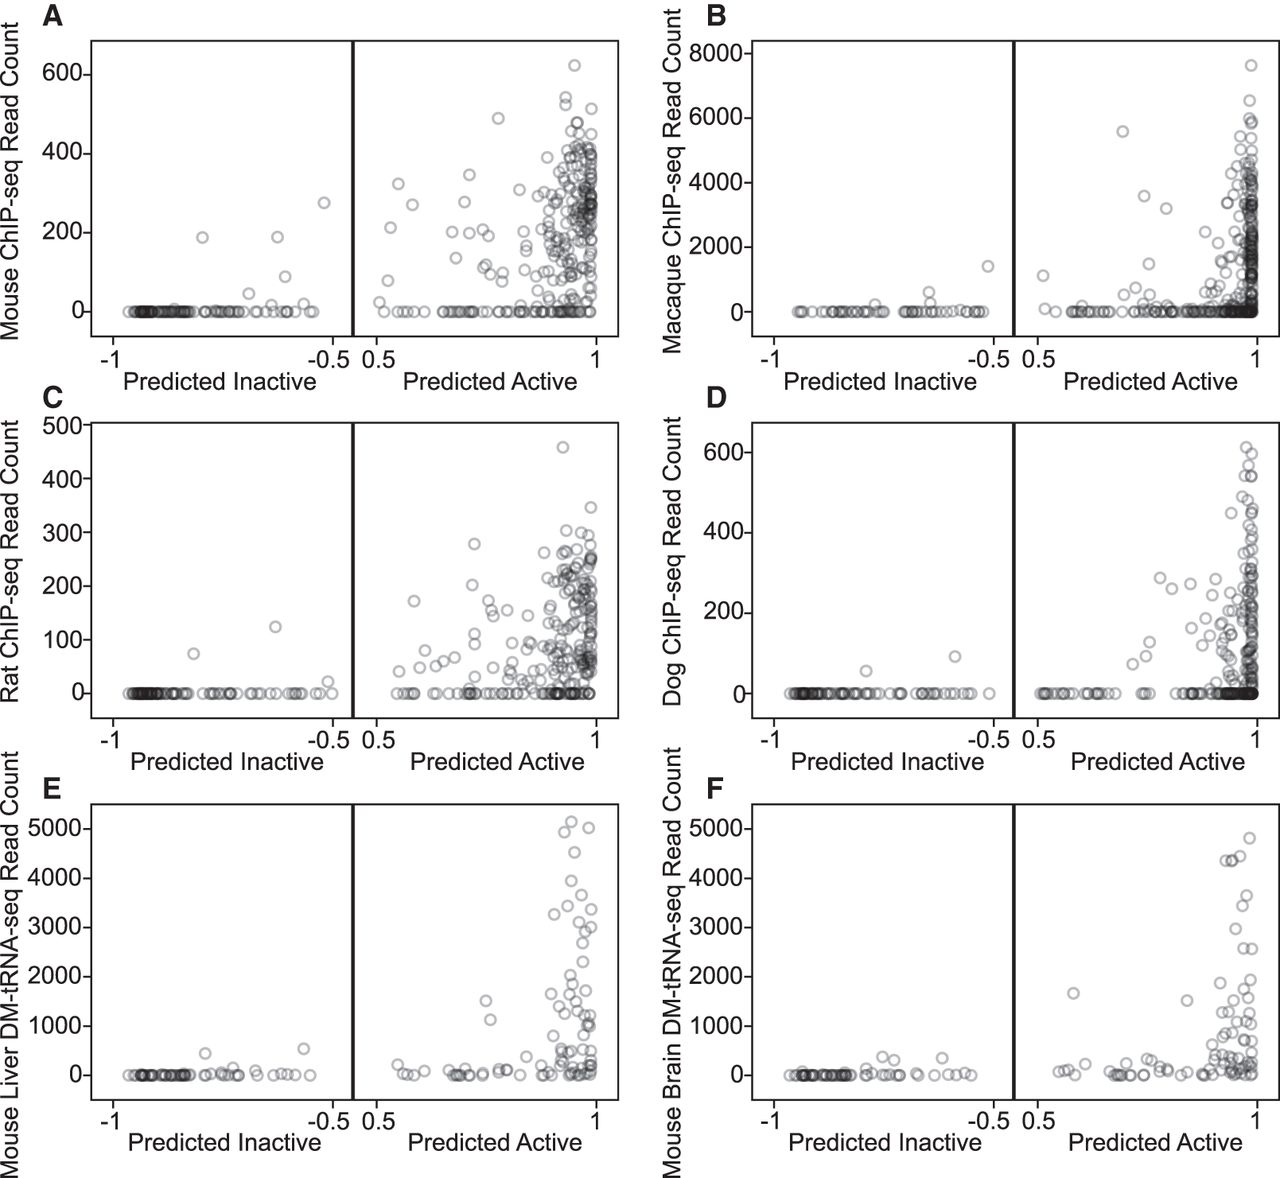
Classification of gene activity based on genomic data achieves similar results to Pol III ChIP-seq analysis in four species and DM-tRNA-seq in two tissues. Probability scores output by the classifier are shown on the x-axis, where tRNA genes further left are predicted inactive with greater probability, and tRNA genes further right are predicted active with greater probability: (A) mouse; (B) macaque; (C) rat; (D) dog. The y-axis shows Pol III ChIP-seq read counts from the liver of each species for each tRNA gene, from Kutter et al. (2011). Similar patterns are observed for predicted active versus inactive mouse tRNA genes with uniquely mapping DM-tRNA-seq data, comparing to the average normalized read count across three replicates: (E) mouse liver; (F) mouse brain.