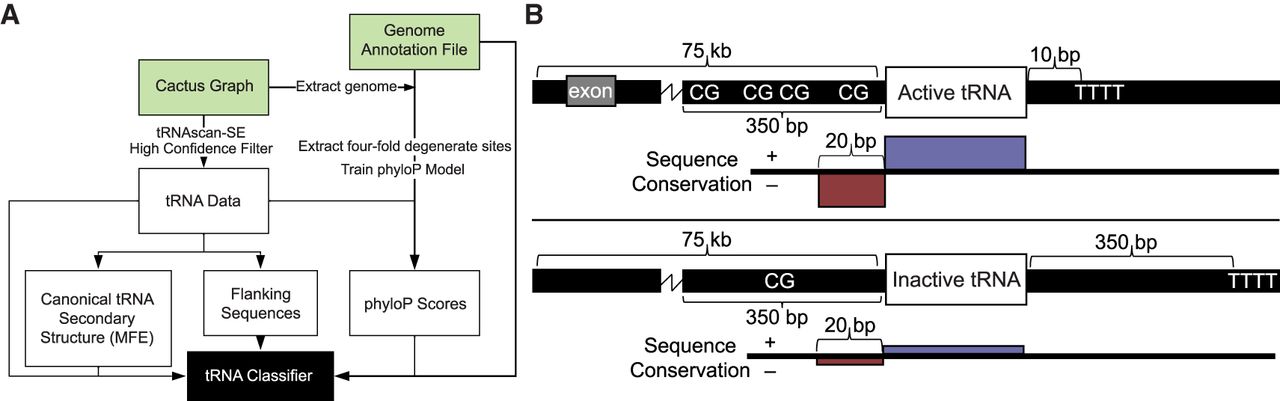
Figure 1.
Schematic of tRNA activity classifier and key features used in prediction. (A) Flowchart of analysis pipeline, which extracts tRNA information solely from genomic data and classifies tRNA genes as active or inactive. Green blocks indicate files not created by the pipeline. By default, the method uses a Cactus graph (Armstrong et al. 2019), which is a reference-free whole-genome alignment, and a genome annotation file as input. (B) Active tRNA genes generally have more CpG dinucleotides in their 350-bp upstream flanking regions, more proximal transcription termination sequences (“TTTT”), are within 75 kb of more exons, and have more highly conserved gene sequences and more evolutionarily divergent 20-nt 5′ flanking regions.