Skip to main content
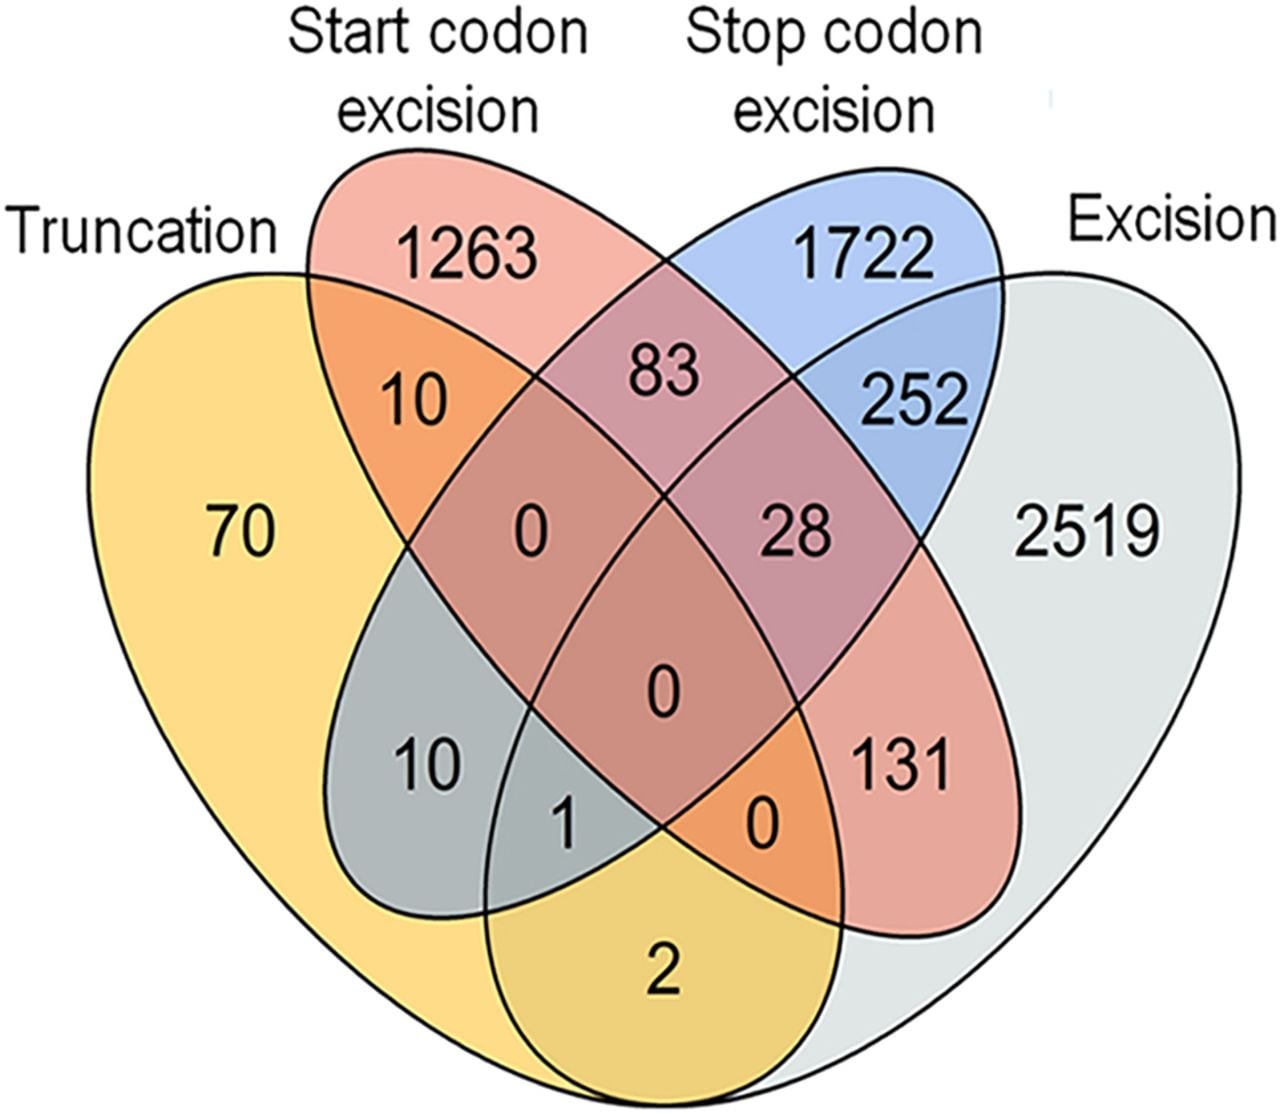
Figure 3.
Venn diagram showing the number of AS-sORFs influenced by different AS events.