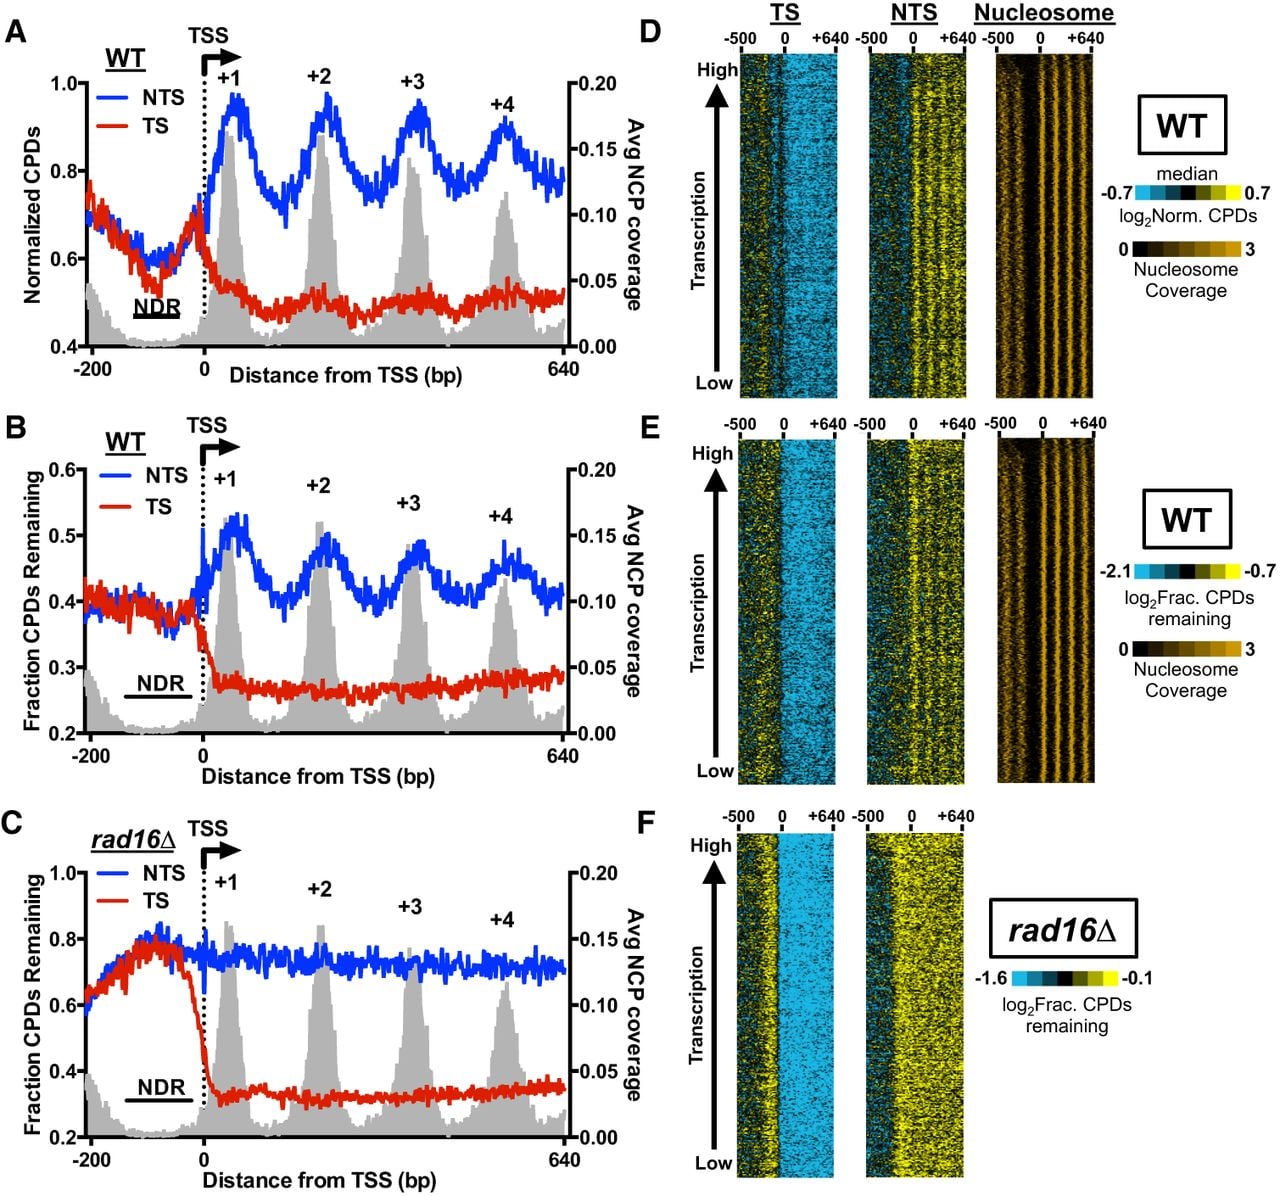
Repair of the NTS is modulated by the nucleosome organization downstream from the transcription start sites (TSSs) for nearly all yeast genes. (A) High-resolution analysis of normalized CPD levels around the transcription start site (TSS) in wild-type (WT) cells following 2-h repair. The TSSs for 5205 yeast genes were aligned, and the number of CPDs associated with either the TS or NTS from 200 bp upstream of to 640 bp downstream from the TSS (indicated by the dotted line/arrow) in WT cells following 2-h repair was counted. CPD counts were divided by the strand-specific dipyrimidine frequencies associated with each position to calculate the normalized CPD levels. The average nucleosome coverage associated with each nucleosome dyad position, derived from a published yeast MNase-seq nucleosome map (Weiner et al. 2015), was plotted in gray. NDR denotes the nucleosome-depleted region upstream of the TSS, and the highly phased nucleosomes downstream from the TSS are labeled as +1, +2, +3, and +4. (B) Same as A, except CPD counts at 2 h were divided by the counts at 0 h at each position to analyze the fraction of remaining CPDs in the WT 2-h sample (i.e., WT-2 h/WT-0 h). (C) Same as B, except CPD-seq data in the rad16Δ mutant were analyzed. (D) Gene cluster plot of normalized CPDs in WT cells after 2-h repair from 500 bp upstream of to 640 bp downstream from the TSS, across 4557 yeast genes. The TS is depicted in the left panel, and NTS is depicted in the middle panel. Each column represents a 30-bp window, and the rows correspond to the CPD data for yeast genes. To display the plot in a compact manner, each row/pixel corresponds to approximately 16 yeast genes. Median levels of CPDs are depicted in black, whereas blue and yellow indicate low and high levels of CPDs, respectively (see color bar). Rows were sorted by transcriptional frequency (Holstege et al. 1998), from lowest to highest. Nucleosome coverage associated with each dyad position, based on a published yeast MNase-seq nucleosome map (Weiner et al. 2015), is depicted in the right panel. (E) Same as D, except the fraction of CPDs remaining was plotted, by calculating the log2ratio of the CPDs in the WT 2-h sample relative to the WT 0-h sample for each 30-bp window. (F) Same as E, except CPD-seq data in the rad16Δ mutant were analyzed.