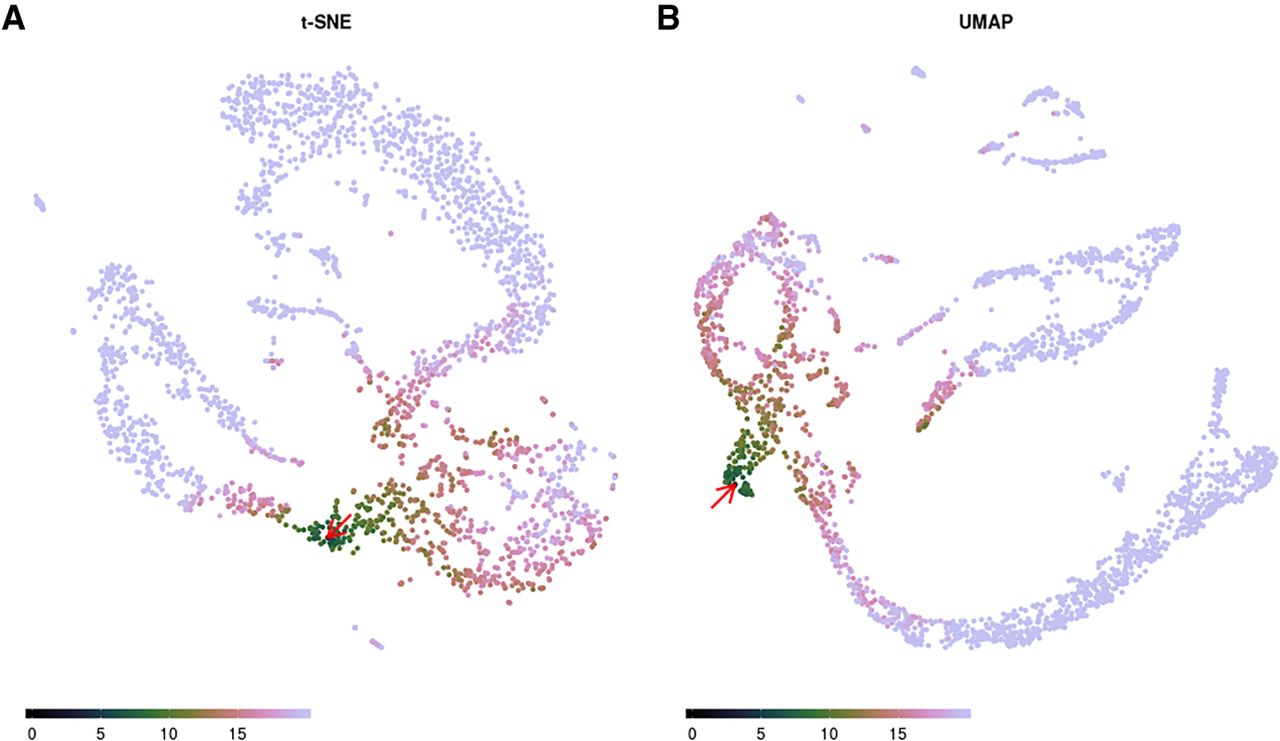
Figure 3.
Sleepwalk being used to compare two embeddings of the same single-cell data of a developing murine cerebellum at embryonal time point E13.5 (Carter et al. 2018): t-SNE (A) and UMAP (B). The user can explore one embedding in the same way as in Figure 2, while all other embeddings that are displayed concurrently are “slaved” to the one under the mouse cursor: Each cell has the same color in all embeddings. The red arrow shows the current mouse position. A live version (for these data and for the cord-blood data) can be found in the Supplemental HTML file.