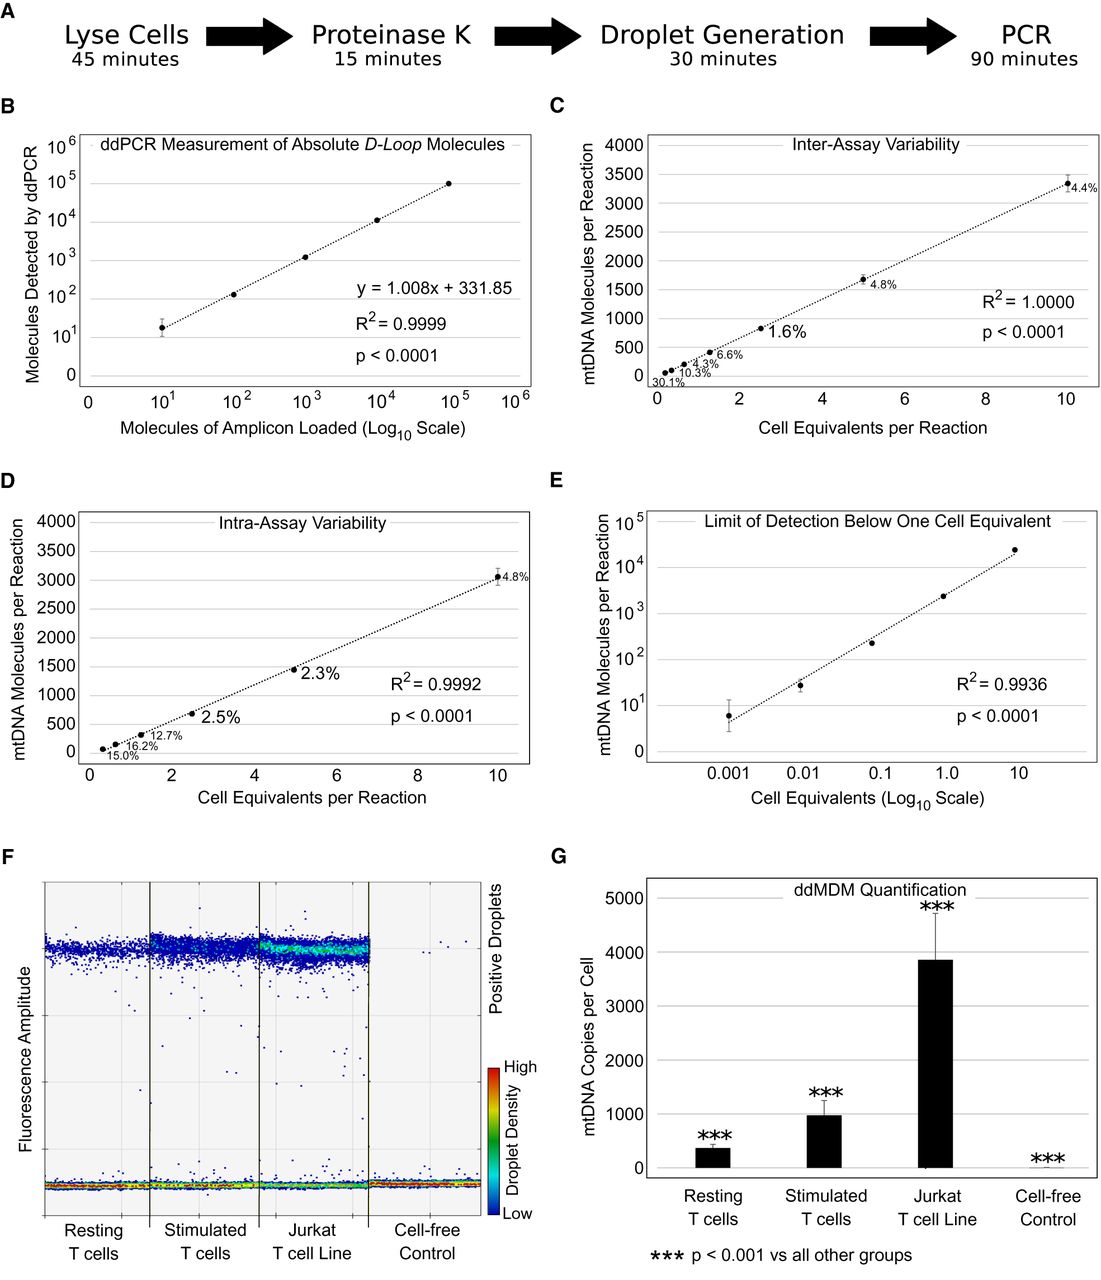
Optimized workflow and validation of the method. (A) General workflow of ddMDM for the quantification of mtDNA on a per cell equivalent basis using ddPCR. (B) Absolute quantification of D-Loop amplicons by ddPCR in a 10-fold dilution series. Axes are displayed in log10 scale. Error bars show the standard deviation of four technical replicates. (C) Inter-assay variability of ddMDM. Data points represent the mean of means of four biological replicates run in duplicate (seven separate dilution series of early passage BJ fibroblasts’ cell lysates). Adjacent numbers show the coefficient of variation (CV) of the means. (D) Intra-assay variability of ddMDM. Data points represent the average of five technical replicates from a single twofold dilution series of early passage BJ fibroblasts. (E) Limit of detection. Tenfold dilution series in late passage BJ fibroblasts. Data points show the average of two experiments run in triplicate. Error bars display the standard deviation of the six replicates. (F) ddPCR output showing resting and stimulated T lymphocytes, Jurkat T leukemia cells, and a cell-free (lysis buffer) control. Each lane shows a single ddPCR well, containing an input of 5 cell equivalents. Dots represent emulsion droplets. (G) Quantification of ddPCR results. mtDNA copy number was calculated per cell equivalent. Error bars show the standard deviation of biological replicates. Significance was determined by ANOVA (Tukey's multiple comparisons).