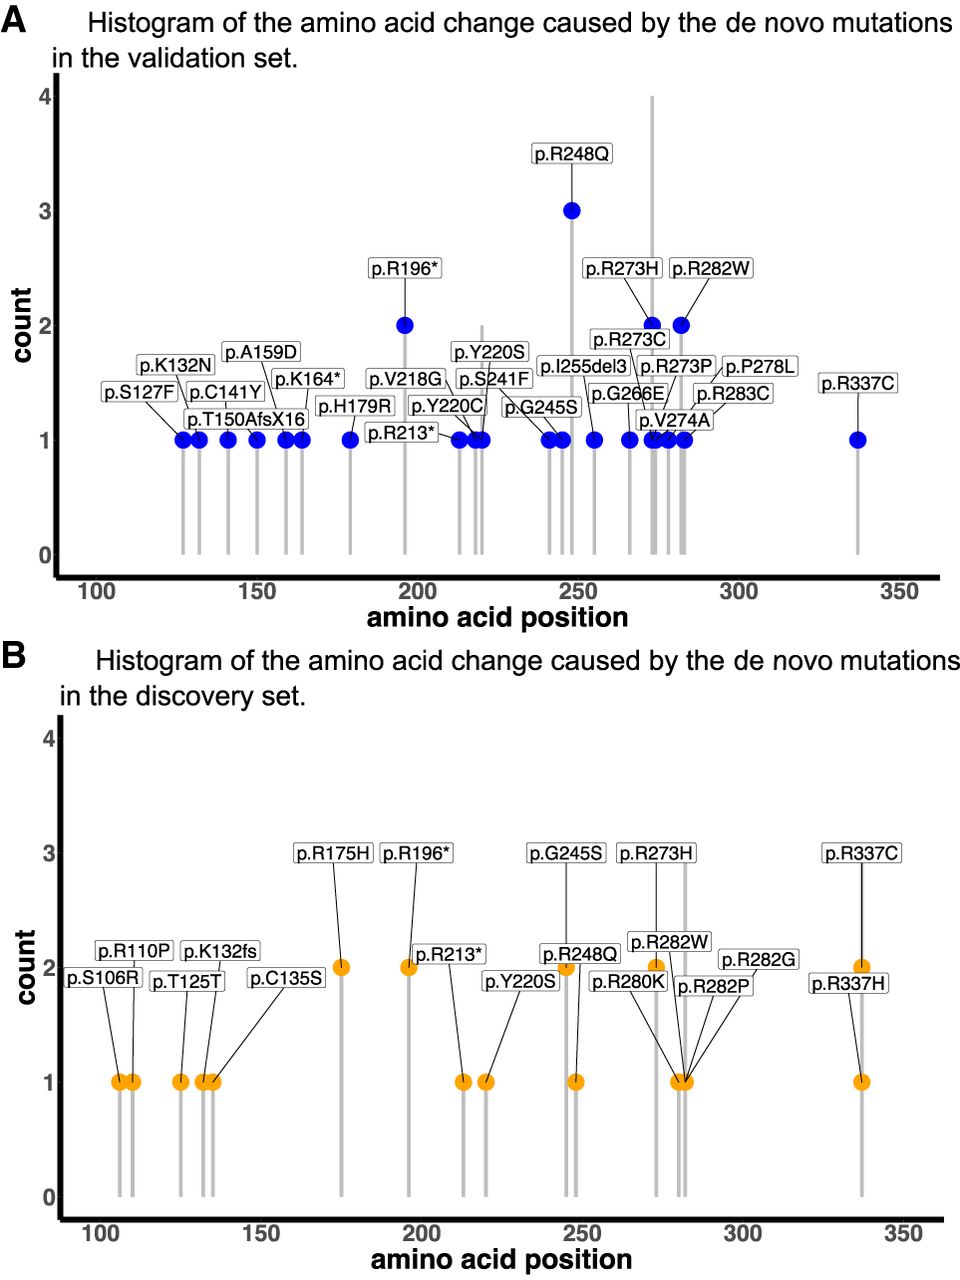
Figure 6.
Histograms of DNM frequency at different amino acid positions in the validation and discovery sets. (A) The validation set. (B) The discovery set. The y-axis shows the count of DNMs. The x-axis shows the amino acid positions.
Histograms of DNM frequency at different amino acid positions in the validation and discovery sets. (A) The validation set. (B) The discovery set. The y-axis shows the count of DNMs. The x-axis shows the amino acid positions.