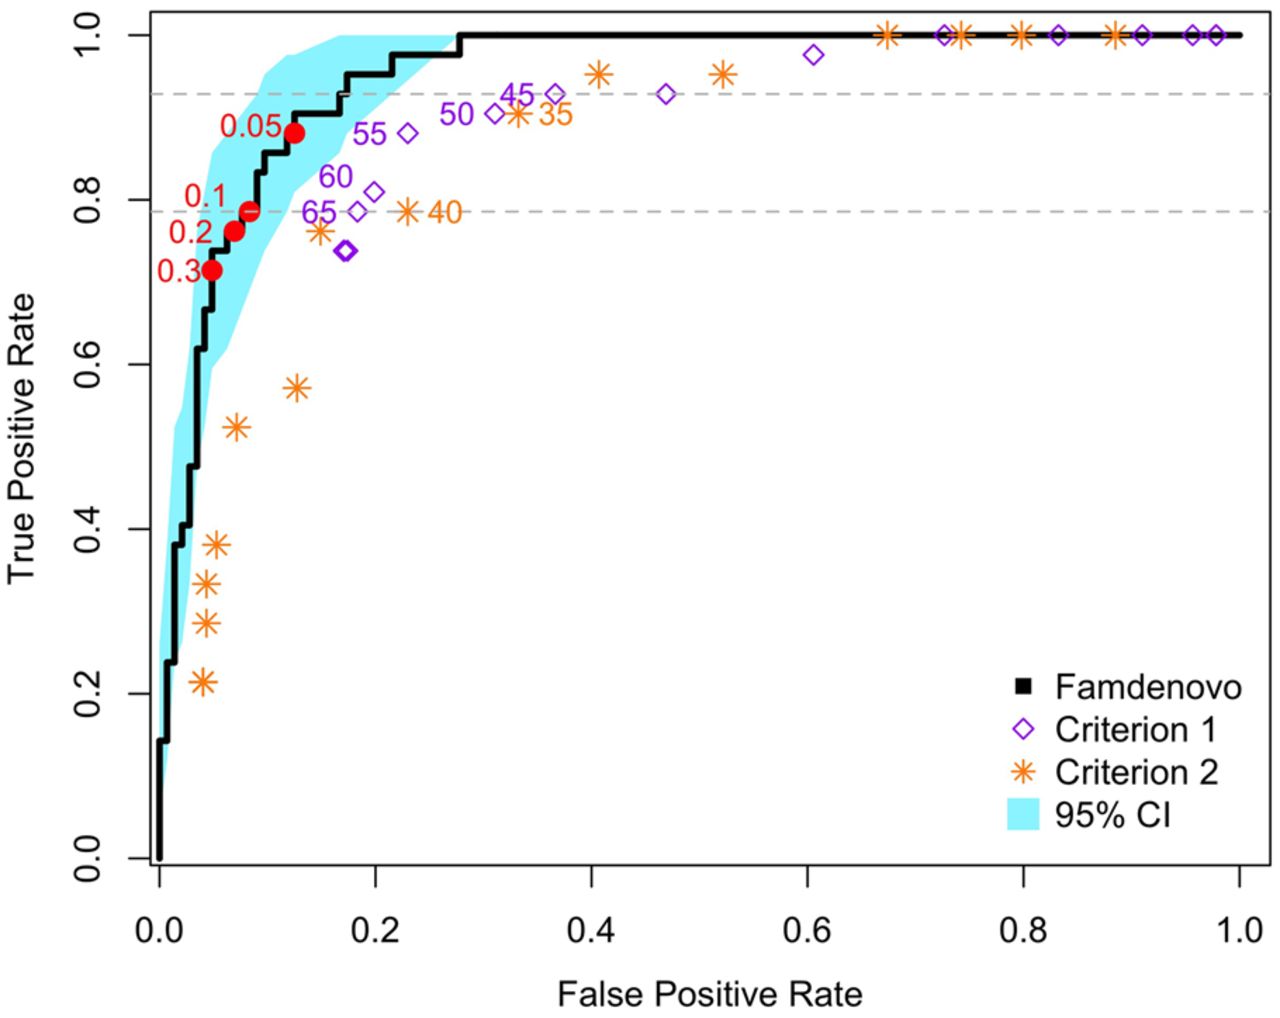
Figure 3.
ROC curves for the validation of Famdenovo.TP53. The x-axis is the false positive rate (i.e., 1 – specificity), and the y-axis is the true positive rate (i.e., sensitivity). The black curve corresponds to the results of Famdenovo.TP53 on the 186 families in the validation set, and the blue shade shows the 95% confidence interval. The red circles represent the different de novo cutoff probabilities for the model. The purple diamonds correspond to the results of criterion 1 at a cutoff age (provided next to the diamonds). The orange stars represent the result of criterion 2 at a cutoff age (provided next to the stars). The gray dotted lines show the range of cutoff ages, 45–65, where a partial AUC is calculated for criterion 1.