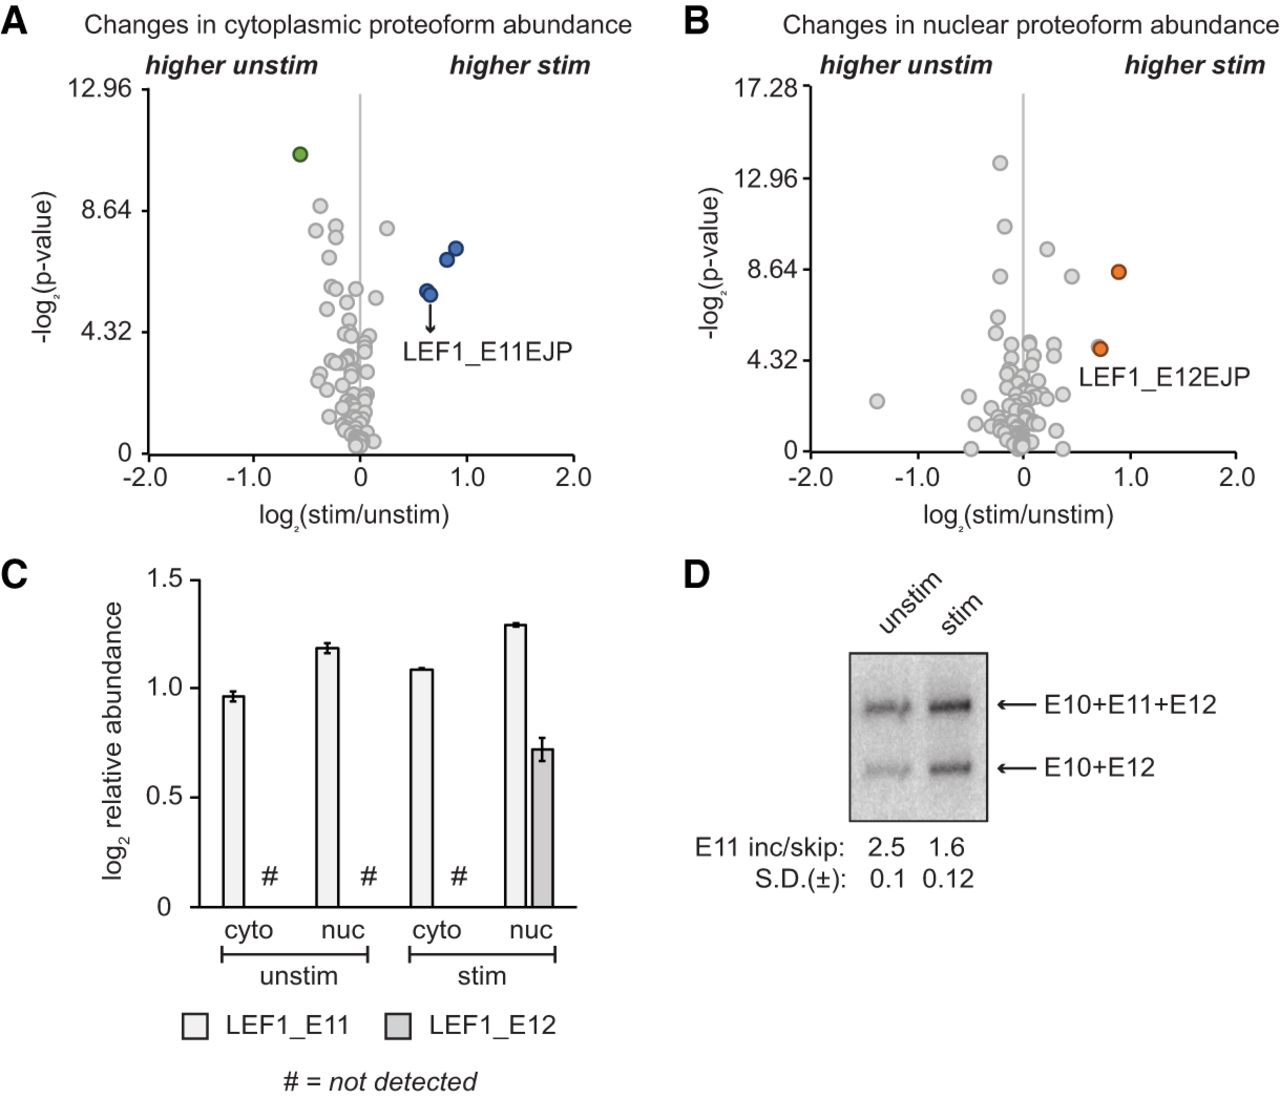
Figure 5.
Analysis of differential proteoform expression. (A,B) Volcano plot of log2 ratio (stimulated/unstimulated) cytoplasmic (A) and nuclear (B) proteoform abundance (MS-DIA) versus −log2 P-value; significance was set at 1.5-fold change (>|0.58| when log2 transformed) versus P-value <0.05 (>4.32 when −log2 transformed), respectively. (C) Quantification of LEF1 proteoforms using EJPs generated by AS of LEF1-E11. (D) RT-PCR analysis of LEF1-E11 inclusion (upper band) and skipping (lower band). Bands were detected with a Typhoon Phosphorimager and quantified with ImageQuant software (n = 3).