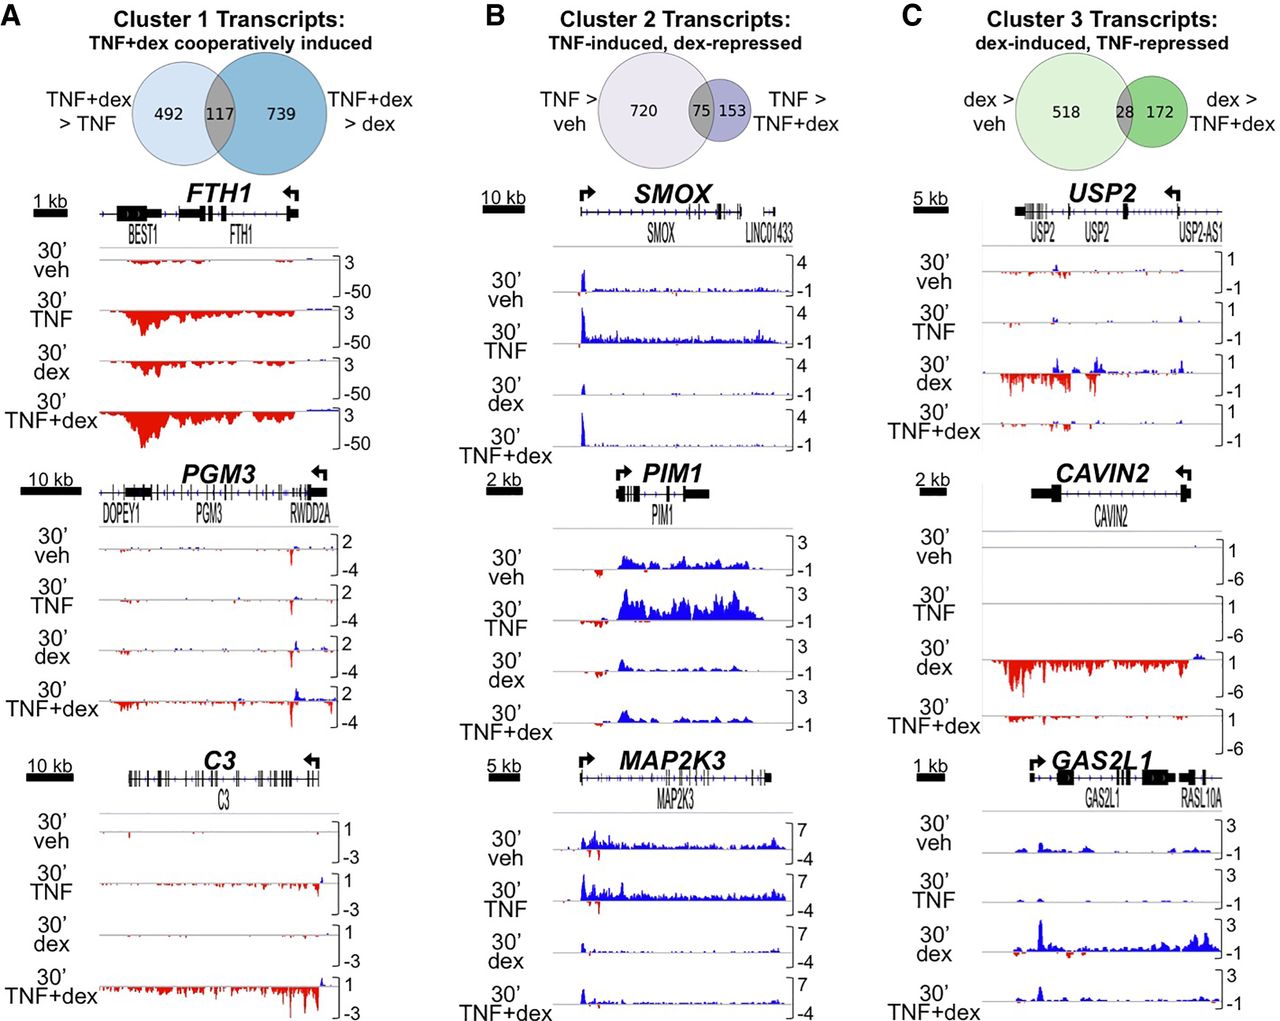
Figure 2.
GRO-seq reveals distinct patterns of transcriptional crosstalk between TNF and dex. (A–C, top) Criteria used to cluster transcripts by indicated pattern of TNF + dex regulatory crosstalk and Venn diagrams showing how many differentially regulated transcripts (based on padj < 0.05) following 30-min treatment met the established criteria. (A–C, bottom) IGV screenshots of GRO-seq data, as described for Figure 1, illustrating examples of each crosstalk pattern.