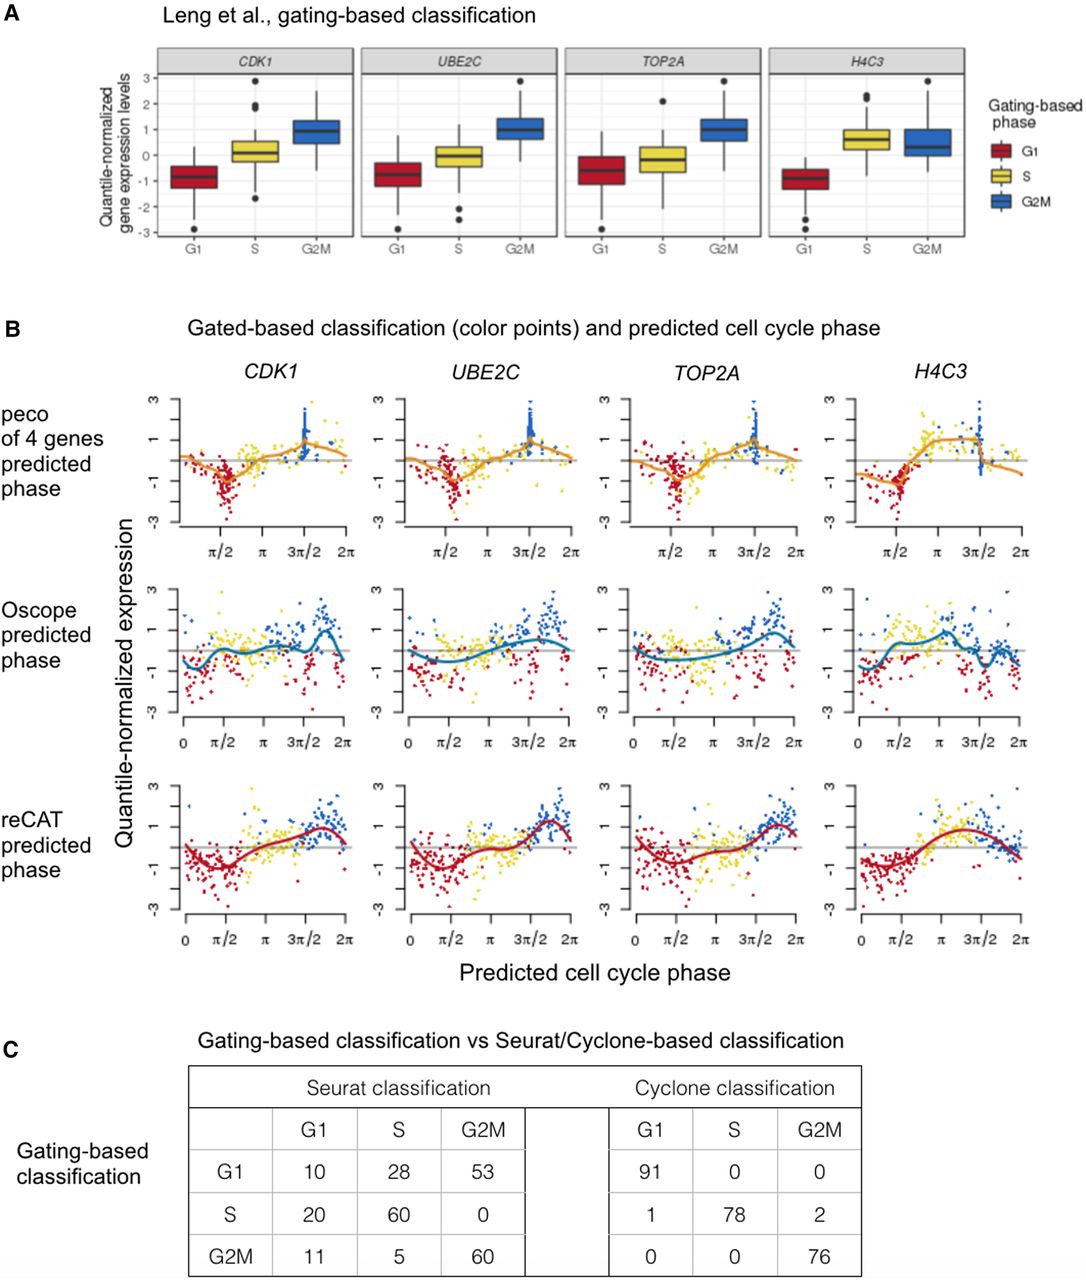
Applying peco and existing tools to data from Leng et al. (2015). The single-cell samples in this data were sorted into G1, S, and G2M phase. (A) We plot the distribution of gene expression for the top four cyclic genes per cell cycle phase. (B) We compare predicted phases based on peco, Oscope, and reCAT. Rows correspond to prediction results based on the three methods. Specifically, we sort the single-cell samples according to the predicted phase, and we color the sample points according to the gated phase. For example, in the first row, we show that the peak expression profile of peco prediction is consistent with results based on gating. The orange line corresponds to the cyclic trend of expression levels. (C) We compare the phase assignment based on gating with Seurat/Cyclone-based classification.