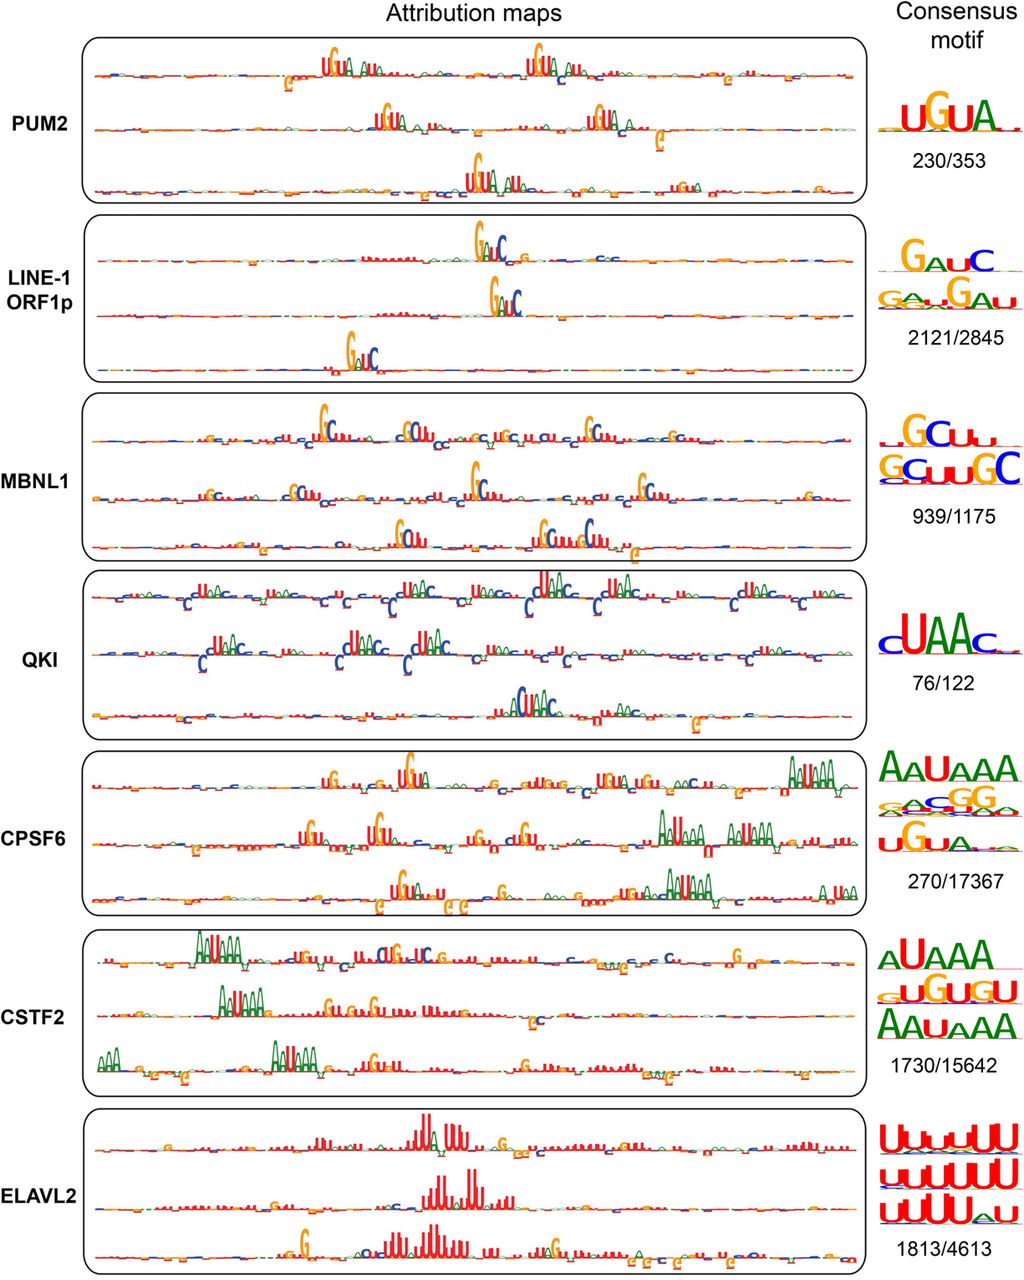
Interpretation of the model using attribution maps obtained from the IG method. For each RBP, the sequence logos corresponding to the attribution maps of three true binding sites with the highest DeepRiPe prediction scores are shown. Consensus motifs, obtained from attribution maps of all true binding sites of the RBP with prediction scores larger than 0.5, are shown beside the attribution maps. The ratio of the number of binding sites used to obtain the consensus motif to the number of all true binding sites is written below the corresponding consensus motif. The observed patterns in both the attribution maps and the consensus motifs resemble the known motif(s) for the specific RBPs: PUM2 (UGUAHAUA), QKI (ACUAAY), MBNL1 (YGCU/GCUU), CPSF6 (AAUAAA and UGUA), and CSTF2 and CSTF2T (AAUAAA and U/GU-rich).