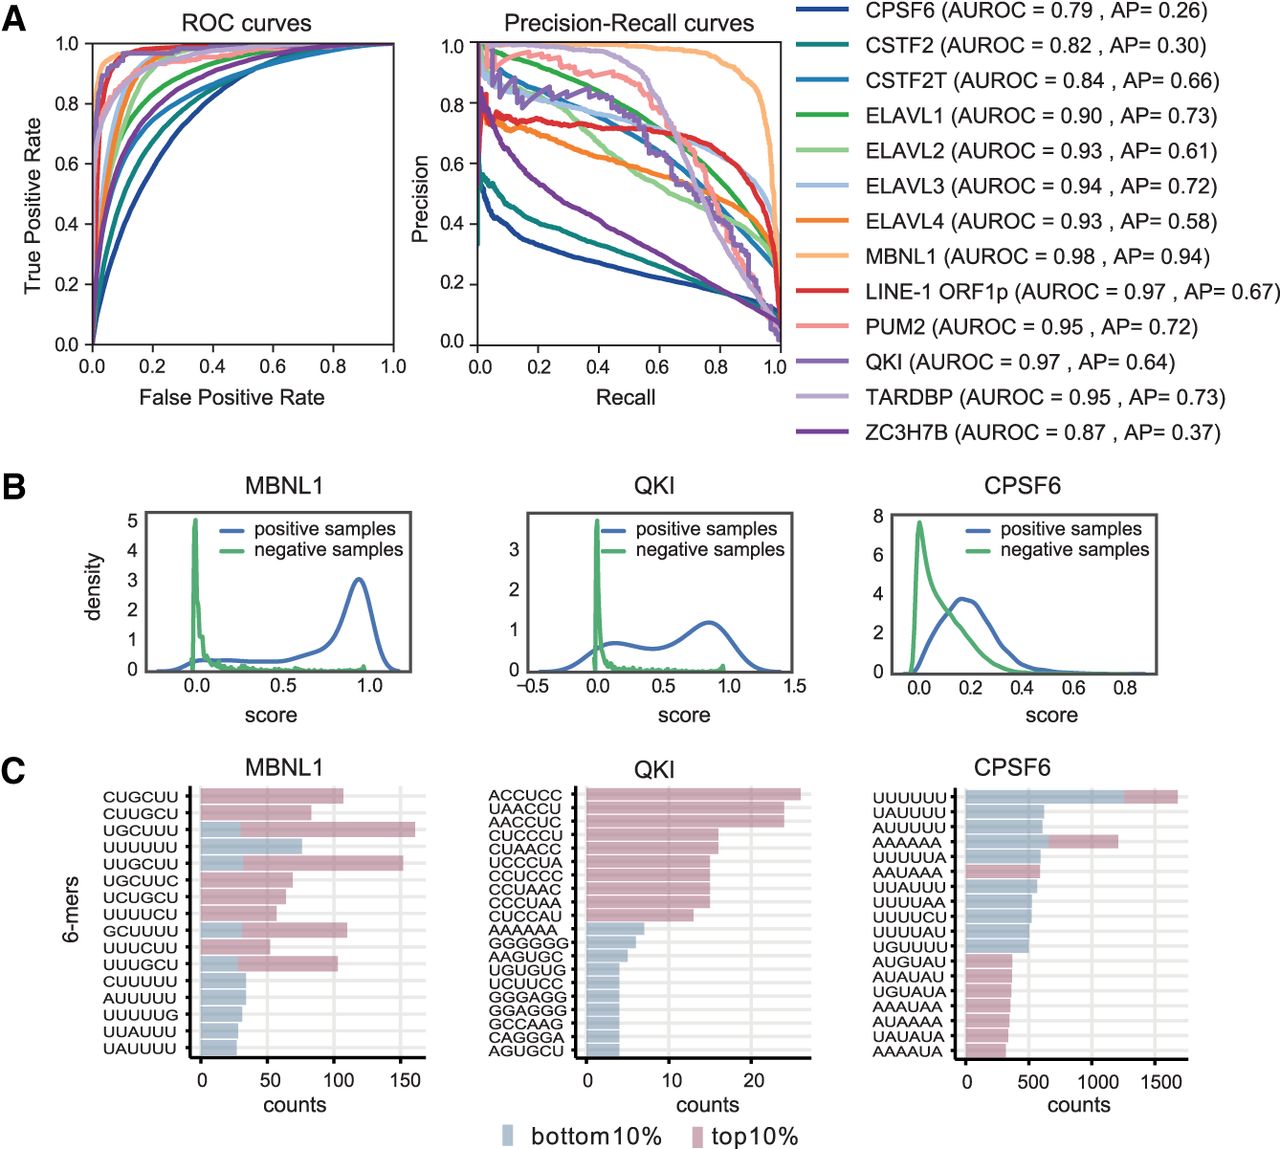
Figure 2.
Performance of DeepRiPe. (A) ROC and precision-recall curves for several RBPs. The corresponding AUROC and AP scores are shown in parentheses. (B) Prediction score distributions for positive and negative samples for MBNL1, QKI, and CPSF6. (C) The 6-mer counts at the top and bottom 10% of the positive samples for MBNL1, QKI, and CPSF6, ranked based on their prediction scores.