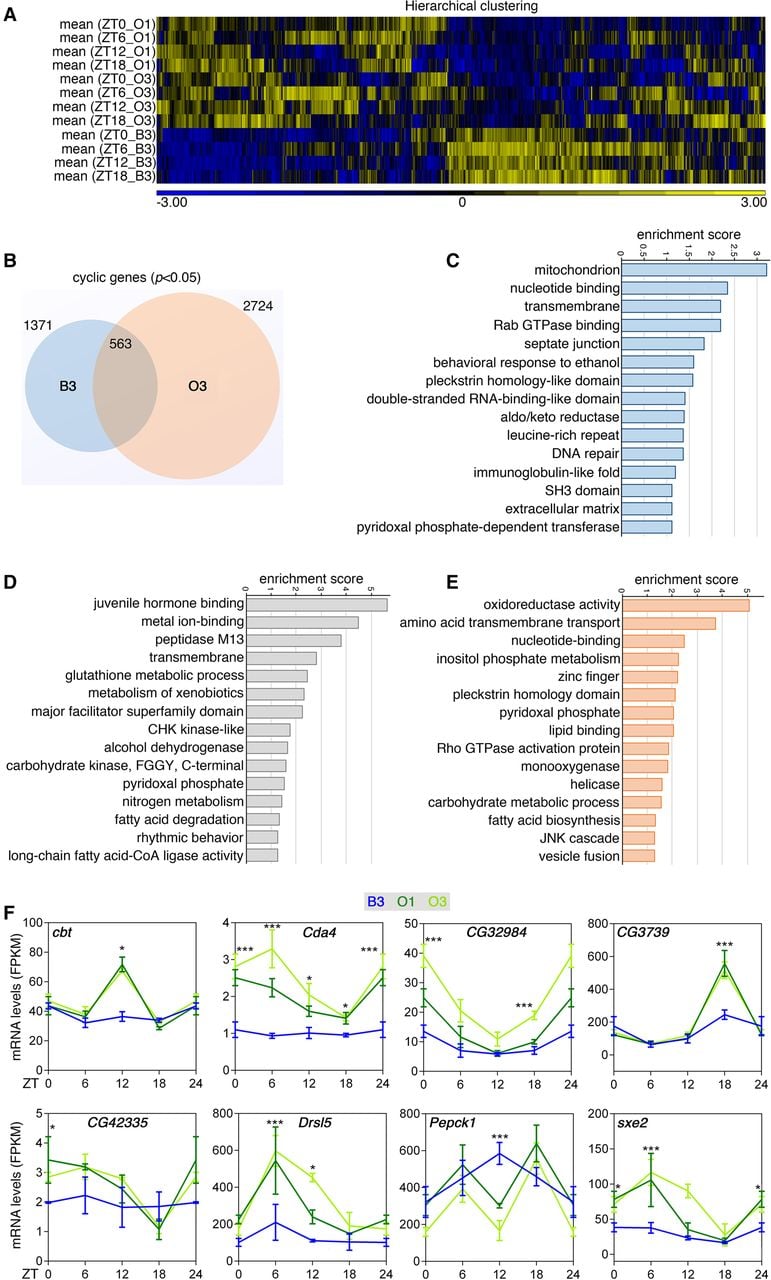
Adaptation of the muscle circadian transcriptome in long-lived O lines. (A) Hierarchical clustering of the muscle gene expression changes occurring at different time points (ZT) in the day. All genes that are statistically defined as cyclic (adjP < 0.05) in at least one JTK analysis were included. (B) Comparison of cyclic genes detected in the muscle of B3 versus O3 lines reveals distinct gene sets that are strain-specific or shared across strains. GO categories that describe rhythmic genes that are B3-specific (C), that cycle in both B3 and O3 (D), and that cycle only in O3 (E) are shown. (F) Examples of genes with increased rhythmicity in the O lines, compared with B3. SD is shown with (*) P < 0.05, (***) P < 0.001. In A–F, n = 3 for each time point and genotype.