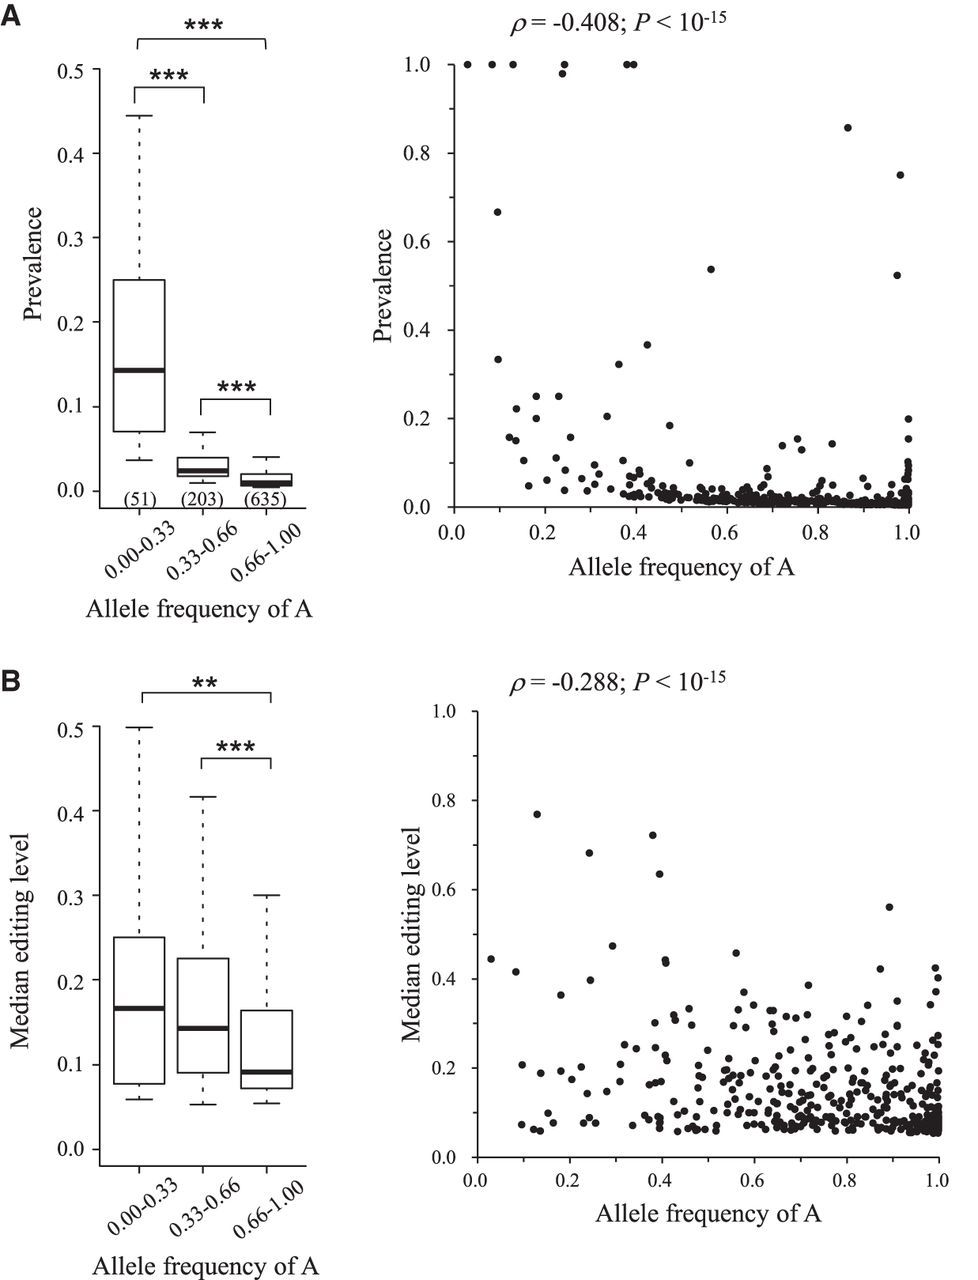
Figure 2.
Correlation between nonsynonymous editing activities and allele frequency of A. Box (left) and scatter (right) plots represent the correlations between nonsynonymous editing activities ([A] prevalence, and [B] median editing level) and allele frequency of A within the LCL population. The number of nonsynonymous editing sites examined in each group is provided in parentheses. Statistical significance was estimated using a two-tailed Wilcoxon rank-sum test (left) and Spearman's rank coefficient of correlation (ρ) (right). (**) P-value < 0.01, (***) P-value < 0.001.