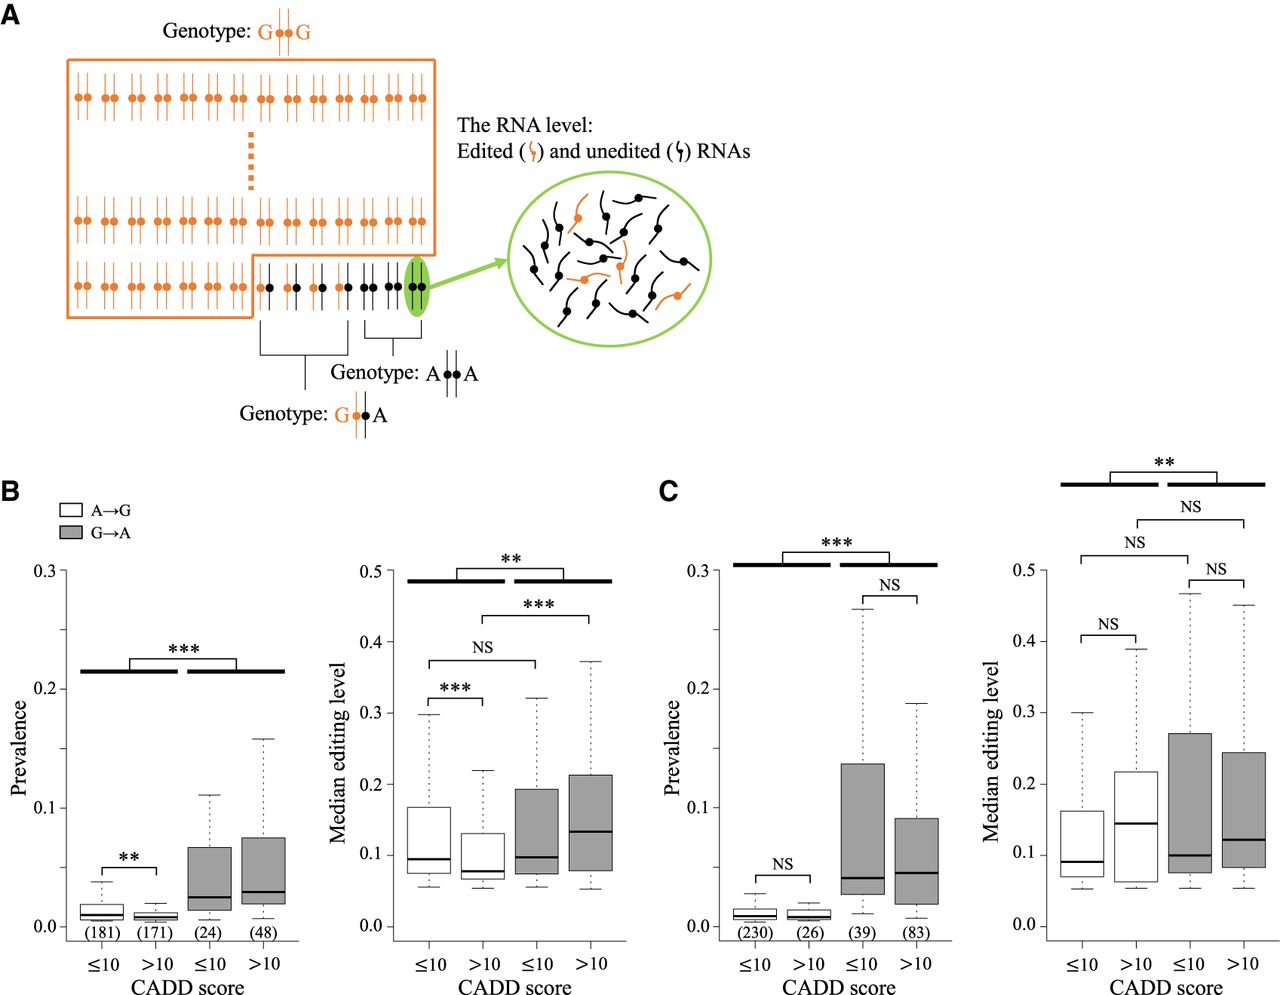
Figure 1.
A-to-G RNA editing activities at A/G genomic variant sites. (A) Schematic diagram of an editing event at a variant site with homozygous genotype AA in a population. A and G represent the minor and major alleles in this population, respectively. (B,C) Comparisons of (B) nonsynonymous and (C) synonymous editing activities (prevalence and median level) at A/G genomic variant sites with harmless (CADD score ≤10) and deleterious (CADD score >10) A-to-G/G-to-A ancestral-to-derived allele changes in the LCL population. The number of editing sites examined in each group was provided in parentheses. P-values were determined using a two-tailed Wilcoxon rank-sum test. (**) P-value < 0.01, (***) P-value < 0.001, (NS) not significant.