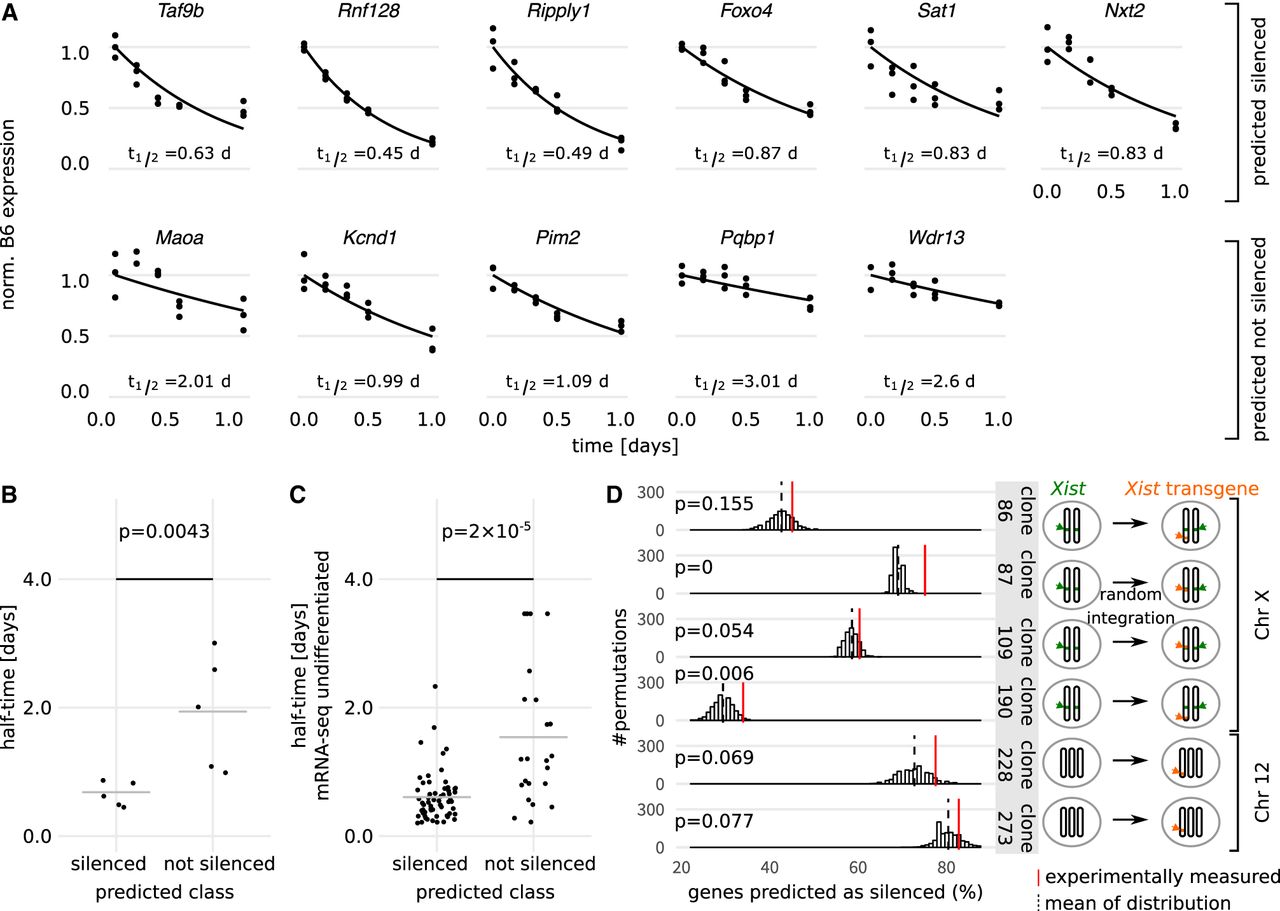
Experimental validation of model predictions. (A) Half-times of six candidate genes predicted as “silenced” (top) and five candidate genes predicted as “not silenced” (bottom) were estimated experimentally through allele-specific quantification by pyrosequencing at different time points during 24 h of doxycycline treatment in TX1072 cells in three independent experiments. Individual data points (dots), the fitted exponential decay function (line), and the estimated silencing half-times are shown. (B) Dot plot of the silencing half-times (t1/2) estimated in A. (C) Dot plot of undifferentiated mRNA-seq half-times for genes predicted as silenced and not silenced by our XCI/escape model. The gray line in B and C indicates the mean, and the P-value (Wilcoxon rank-sum test) indicates a significant difference between the mean of the two distributions. (D) Fraction of genes correctly predicted as silenced by the XCI/escape model (red lines) for six cell lines in which an inducible Xist transgene was integrated in different chromosomal locations (orange, cartoon on the right) (Supplemental Table S5). The background distributions of silenced predictions used to estimate empirical P-values is also shown (histogram, black dashed line represents the mean).