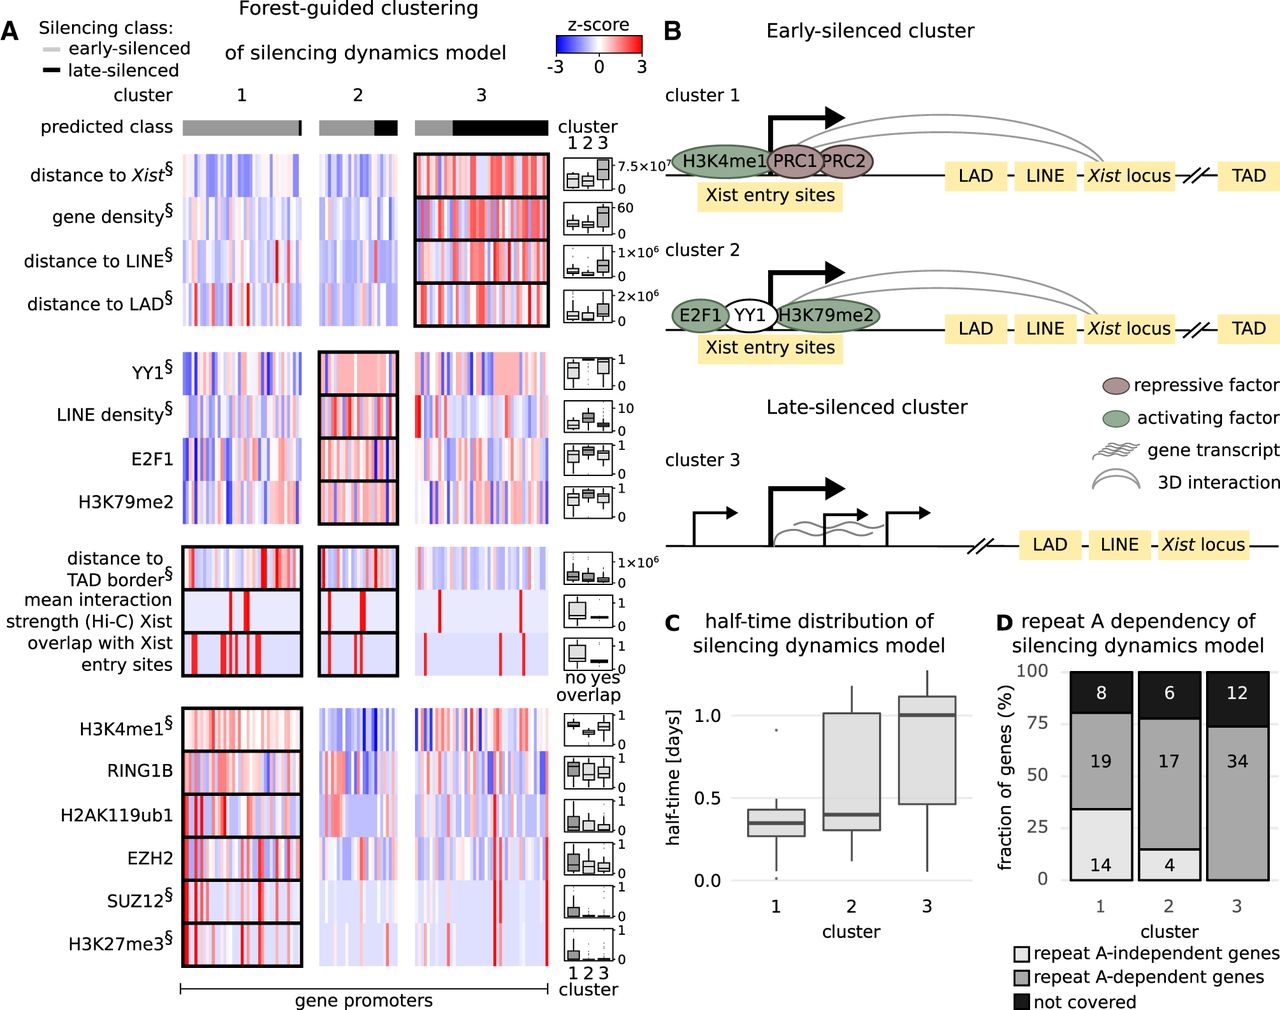
Classification rules for the silencing dynamics model. (A) Results from the forest-guided clustering of the silencing dynamics model visualized as a heatmap. Columns indicate the genes grouped by cluster; rows correspond to features with significant differences among clusters (ANOVA test). (§) The top 10 most significant features from the ANOVA test. Differences in the distributions of features between clusters are highlighted in the box plots next to the heatmap, except for two features, where the number of genes in each category is shown. (B) Schematic view of the features associated with early (cluster 1 and 2) and late gene silencing (cluster 3). (C) Silencing half-time distribution for each cluster. (D) The proportion of genes which undergo silencing in mouse trophoblasts, independent or dependent of the Xist-repeat A element, is shown for each cluster, similar to Figure 5D. The numbers in each box indicate the number of genes that fall into each category.