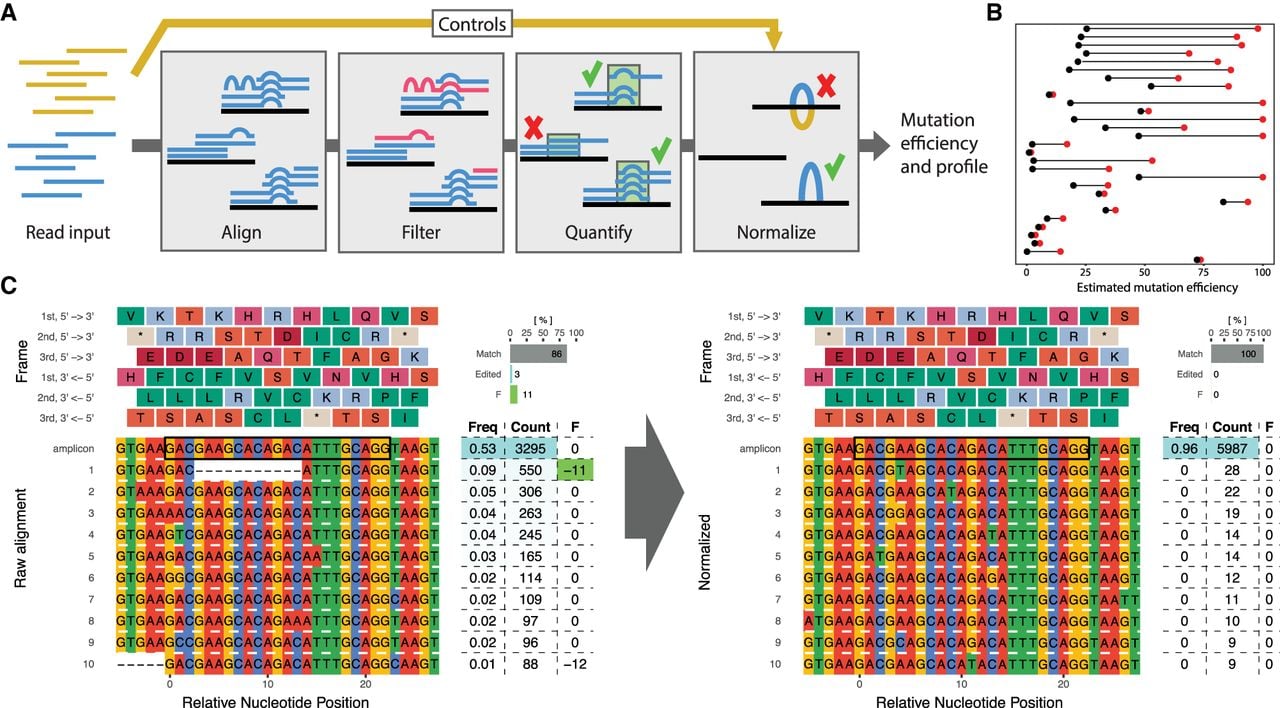
Overview of ampliCan pipeline and normalization. (A) Estimation of mutation efficiency consists of multiple steps. At each of these steps, biases can be introduced. Controls are processed identically to the main experiment and used for normalization. (B) Overview of the change in estimated mutation efficiency on real CRISPR experiments when using controls that account for natural genetic variance in 29 experiments (mean change of 30%). Red dots show initial estimates based on unnormalized data, whereas black dots show the values after normalization. (C) Alignment plot showing the top 10 most abundant reads in a real experiment. The table shows relative efficiency (Freq) of read, absolute number of reads (Count), and the summed size of the indel(s) (F), colored green when inducing a frameshift. The bars (top right) show the fraction of reads that contain no indels (Match), those having an indel without inducing frameshift (Edited), and frameshift-inducing indels (F). The left panel shows the estimated mutation efficiency from raw reads, which is 14% (11% with frameshift, 3% without). The right panel shows the same genomic loci after normalization with controls, resulting in a mutation efficiency of 0%. The deletion of 11 bp in 9% of the reads could not be found in the GRCz10.88 Ensembl Variation database and would, in the absence of controls, give the impression of a real editing event.