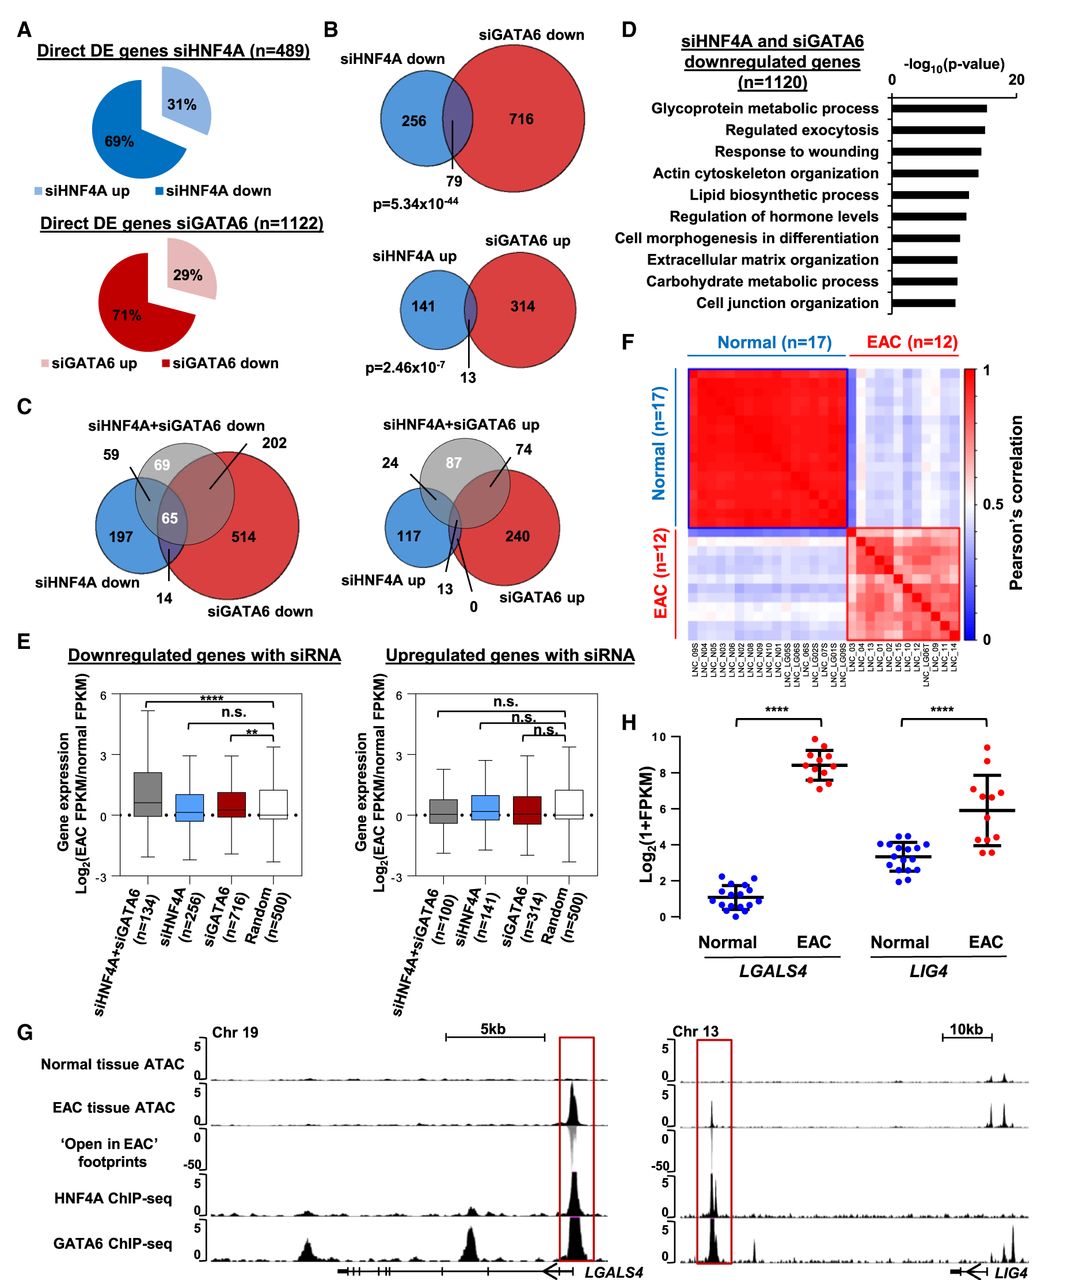
HNF4A and GATA6 target genes are overexpressed in EAC tumors. (A) Proportion of differentially expressed (DE) genes (>1.3-fold; Q-value <0.05) that are up- and down-regulated in OE19 cells following siHNF4A (top) and siGATA6 (bottom) treatment. (B) Overlap of differentially expressed genes in the siHNF4A and siGATA6 data sets. P-value calculated using the hypergeometric test. (C) Overlap of differentially expressed genes that are down-regulated following siHNF4A and siGATA6 cotreatment compared to single siRNA treatments. (D) The top 10 significant “biological processes” GO term analysis of genes down-regulated following siHNF4A, siGATA6, or siHNF4A + siGATA6 treatment. (E) Box plot of changes in gene expression in EAC tissue (shown as cancer/normal FPKM log2 fold change) for genes down-regulated and up-regulated by siRNA against HNF4A (blue), GATA6 (red), or both (gray). Whiskers represent 1.5× IQR. A random (500 randomly selected RefSeq transcripts) data set is represented in white. (****) P < 0.0001; (**) P < 0.01. (F) Pearson correlation plot of Log2(1 + FPKM) values of siHNF4A + siGATA6-regulated genes in normal (n = 17) and EAC (n = 12) patient samples (Maag et al. 2017). Samples were clustered hierarchically, and the two main clusters are highlighted as a “normal” cluster (blue) and an “EAC” cluster (red). (G) UCSC Genome Browser tracks showing ATAC-seq data in normal and tumor tissue (top), “open in cancer” footprints (center), and HNF4A and GATA6 ChIP-seq signals (bottom) at genes regulated by HNF4A and GATA6, LGALS4 and LIG4. (H) Plot showing the expression of LGALS4 and LIG4 in normal (blue) and EAC (red) tissue samples (Maag et al. 2017). Mean is represented by a black bar with standard deviation shown above and below. (****) P < 0.0001.