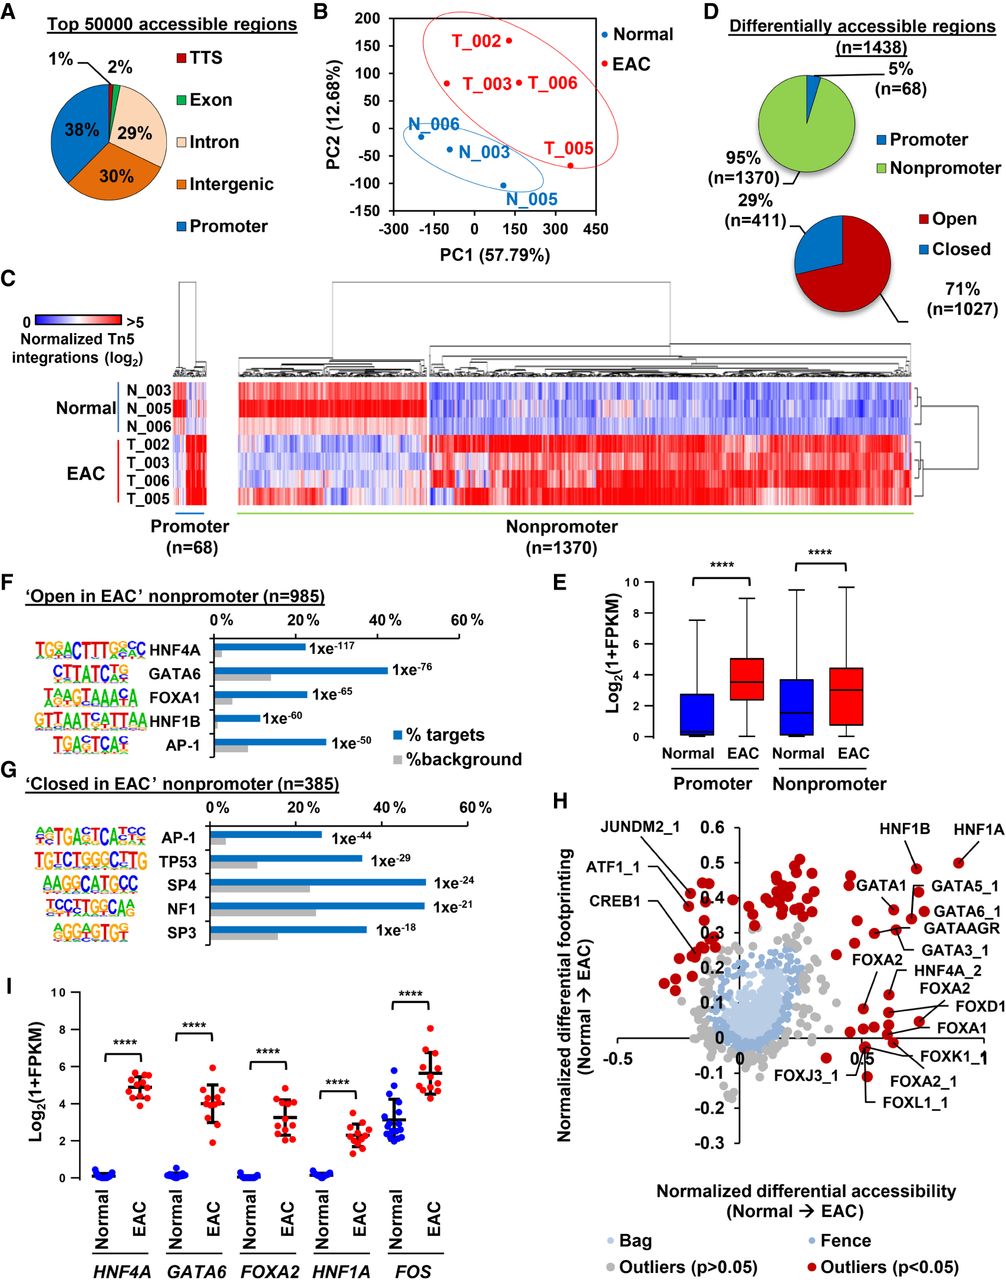
Open chromatin profiling reveals dynamic chromatin accessibility in EAC. (A) Genomic distribution of the top 50,000 significant open chromatin regions in combined ATAC-seq data from normal and tumor tissue. “Promoter” refers to −2.5 to +0.5 kb relative to the TSS. (B) PCA plot of ATAC-seq signal across the top 50,000 ATAC-seq regions in three normal tissue samples (blue) and four tumor tissue samples (red). (C) Heatmap of normalized Tn5 cleavage events in a ±250-bp region surrounding the summits of differentially accessible promoter and nonpromoter regions (linear fivefold difference, Q < 0.05). Hierarchical clustering was performed on samples and regions using 1-Pearson's correlation. (D) Pie charts representing the proportion of differentially accessible regions that are located in promoter (−2 kb, +0.5 kb of TSS) and nonpromoter regions (left) and regions that are fivefold more open or closed in tumor tissue (right). (E) Box plot of Log2(1 + FPKM) values of genes associated with promoter and nonpromoter regions that show increased accessibility in EAC (red) compared to normal tissue (blue). Whiskers represent 1.5× IQR. (F,G) The top five DNA motifs derived from de novo motif discovery and their associated transcription factor that are enriched in “open in cancer” (F) or “closed in cancer” (G) nonpromoter regions. The frequency of motif occurrence is shown, and the motifs are sorted by P-value. (H) Scatter bag plot of differential chromatin accessibility (x-axis) and footprinting (y-axis) depth around human transcription factor binding motifs in normal and cancer tissue. Significant outliers (P < 0.05) are represented in red. Transcription factor motifs with enrichment in “open in cancer” are labeled. (I) Plot of Log2(1 + FPKM) values of transcription factors with enriched motifs in “open in cancer” regions in RNA-seq data from normal (blue) or EAC (red) tissue (Maag et al. 2017). Mean is represented by a black bar with standard deviation shown above and below. (****) P < 0.0001.