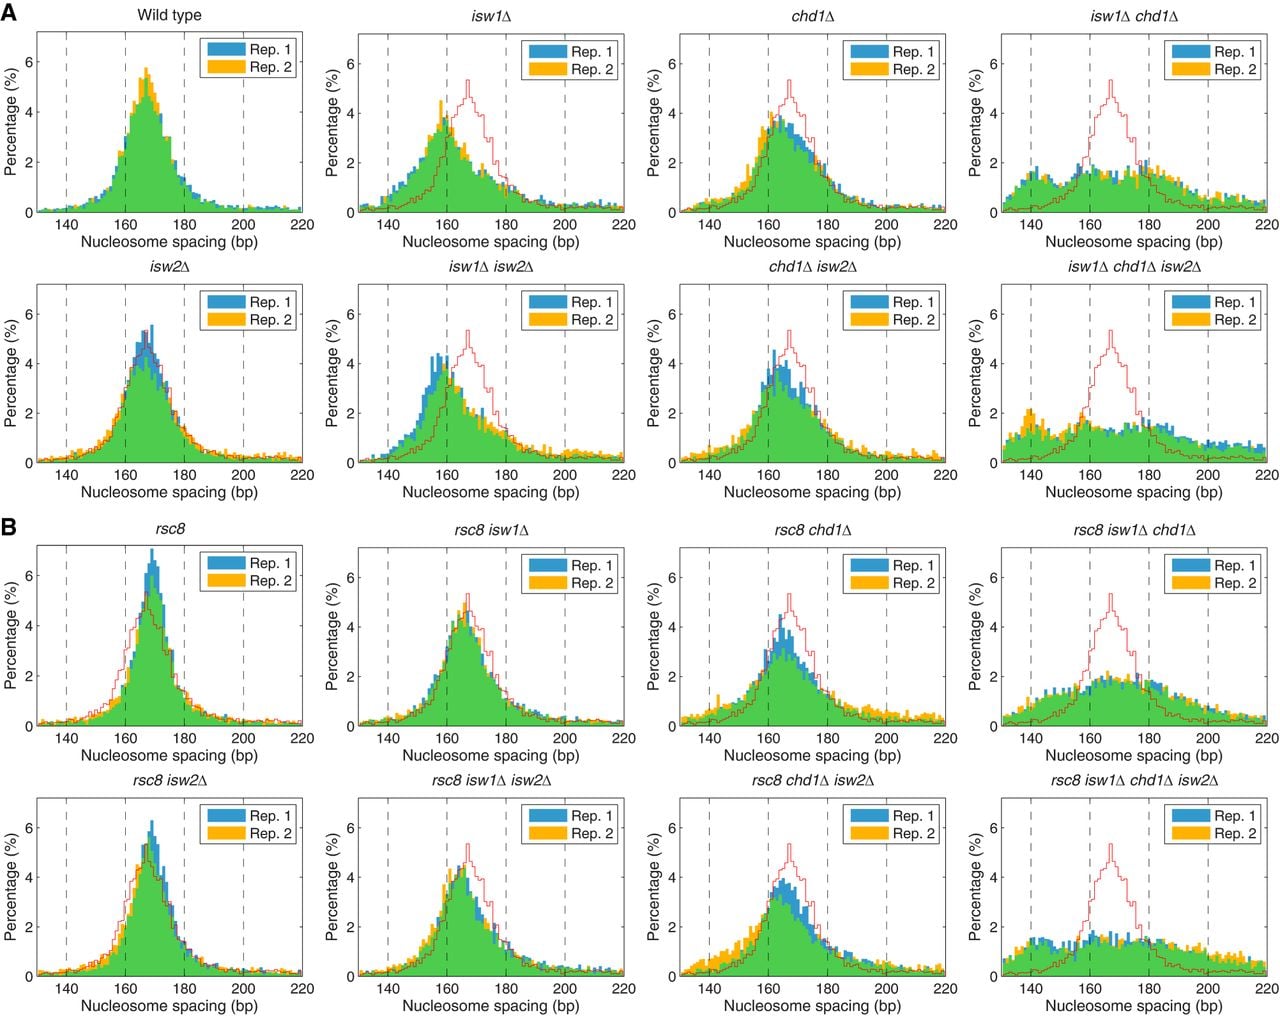
Figure 2.
Nucleosome spacing distributions in the chromatin remodeler mutants. Histograms of the percentage of genes having a given average spacing (1-bp bins). Data from two biological replicates are shown, indicated by blue and yellow bars; overlap is indicated by green bars. For comparison, the wild-type histogram is indicated by the red line. (A) Spacing distributions in wild type, isw1Δ, chd1Δ, and isw2Δ mutants (from Ocampo et al. 2016). (B) Spacing distributions in rsc8 mutants.