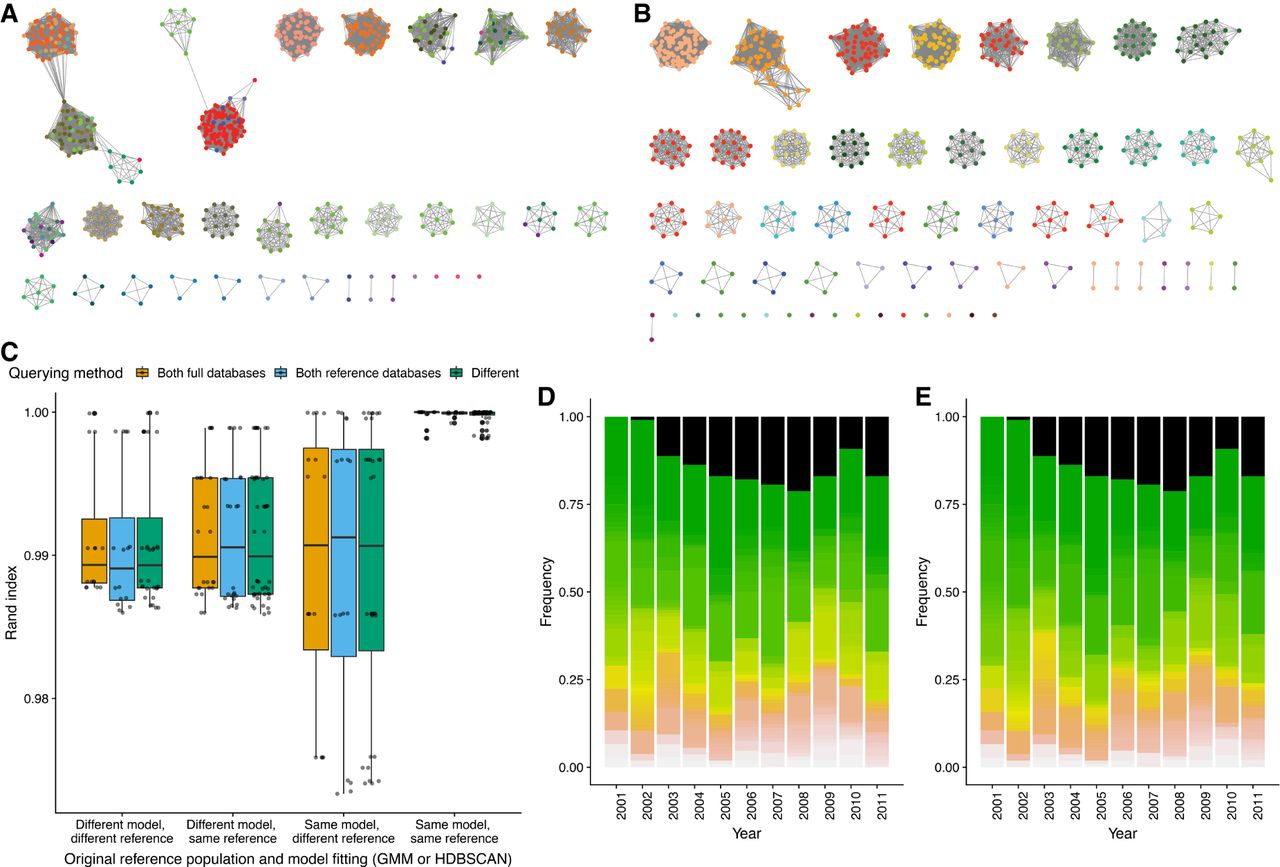
Network and query assignment for S. pneumoniae and E. coli. (A) Cytoscape view of the network for the Massachusetts S. pneumoniae data set using the 2D GMM fit. Nodes (colored dots) are samples and edges (lines) are those pairwise distances classified as within-strain. The nodes are colored by clusters according to the refined fit in B, showing which clusters are incorrectly merged in the mixture model fit. (B) As in A, but showing the network after fit refinement. High-stress edges causing clusters to be merged have been removed after maximizing the network score. (C) Box plots showing the similarities between cluster assignment when running PopPUNK in different modes. The different model types (2D GMM or HDBSCAN) implemented in PopPUNK were each fitted to either the Massachusetts or Maela S. pneumoniae population defined in Corander et al. (2017), then refined. The three nonreference populations were then added in successive batches, either through comparisons to the full data set or a representative set of reference sequences selected based on network structure, in all possible permutations. The Rand index was used to quantify clustering similarity between all those permutations in which the final population to be integrated was the same; only those isolates in the most recent extension of the network were used. These values are shown separated according to the starting reference population (Massachusetts or Maela), initial model (2D GMM or HDBSCAN), and comparison method (bar color; full database or references only). (D,E) Simulating surveillance of the E. coli BSAC population. A five-component 2D GMM was fitted to the pairwise distances between the 2001 isolates, and batches of isolates from successive years added sequentially either retaining the full database throughout (D) or identifying references after each addition (E). The stacked bar charts show the prevalence of strains in the population in each year, with the black component representing isolates of the multidrug-resistance-associated ST131 lineage, which emerged from 2002 onward. The full output of this analysis is provided in Supplemental Table S3.