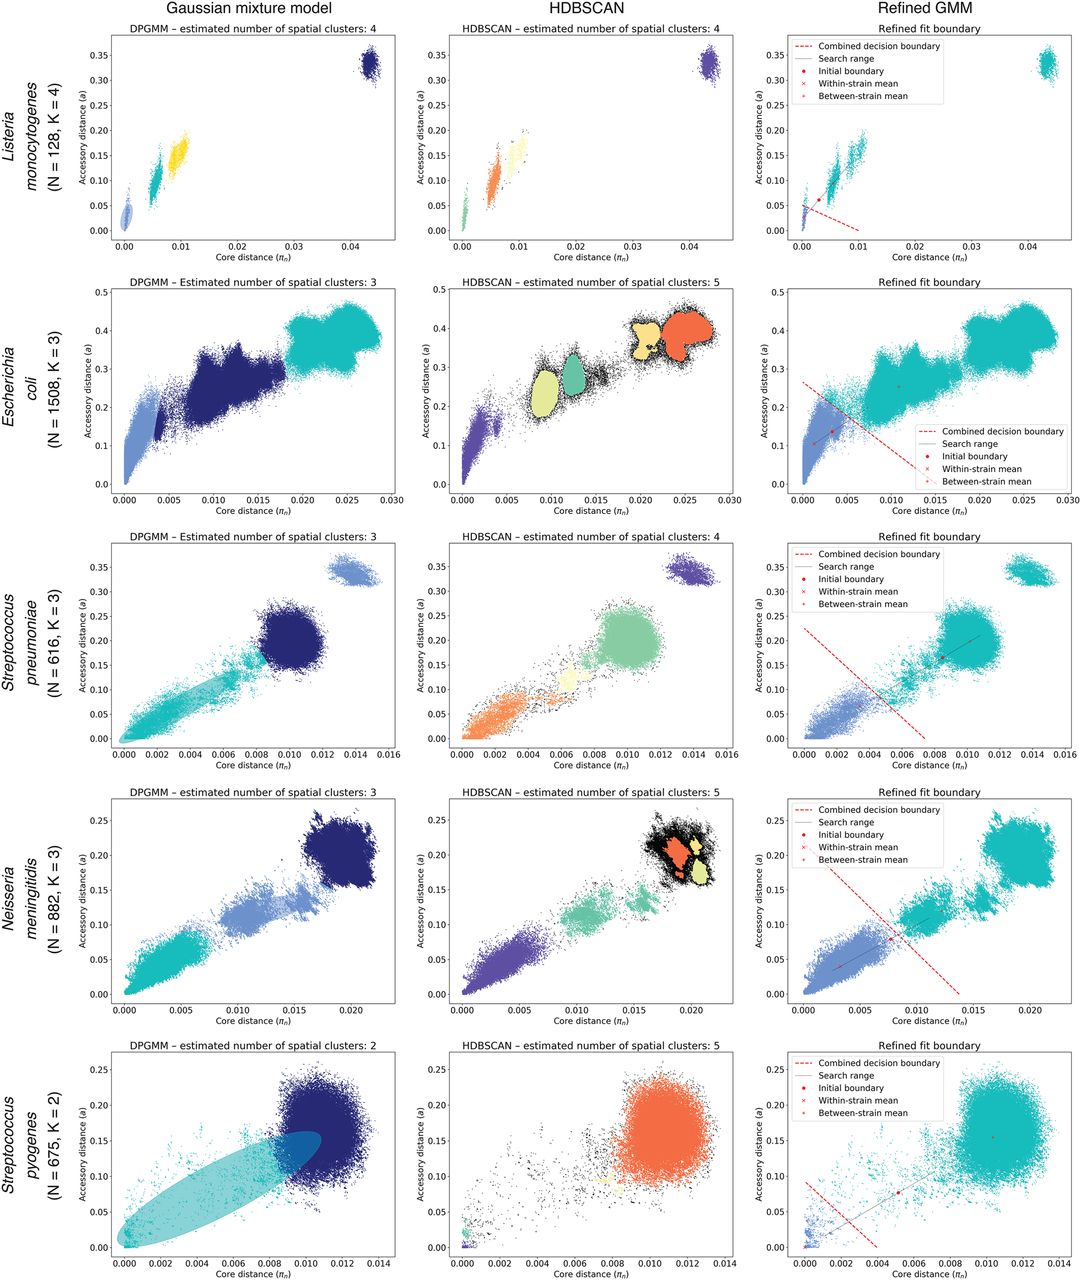
PopPUNK model fitting output for five archetypal examples (other species shown in Supplemental Fig. S8). Each row is a species, with each plot showing the distribution of core and accessory distances. In each plot, points are colored by their predicted cluster, and the cluster closest to the origin is the within-strain cluster. The two-dimensional Gaussian mixture model (2D GMM) is in the left column, which also shows ellipses with the mean and covariance of the fitted mixture components. The HDBSCAN plot in the center column shows unclassified noise points in black. The right column shows the fits when maximizing the network score to refine the 2D GMM fit. Listeria monocytogenes has clearly separated clusters, which were well-predicted by all methods. Although there is more complex structure on the plots, Escherichia coli and Neisseria meningitidis have a within-strain cluster also well captured by all approaches. In Streptococcus pneumoniae, recombination makes the boundary between clusters less distinct, and the mixture model includes too many links (Fig. 5A). HDBSCAN is more accurate, but the refinement of the initial fit provides the most accurate and intuitive demarcation of the within-strain links. Streptococcus pyogenes exhibits low within-strain recombination; hence, it has a dense cluster of points near the origin of the graph, but high between-strain divergence, resulting in the single, broad between-strain set of points. Network score fit refinement is required for an accurate model fit in this case.