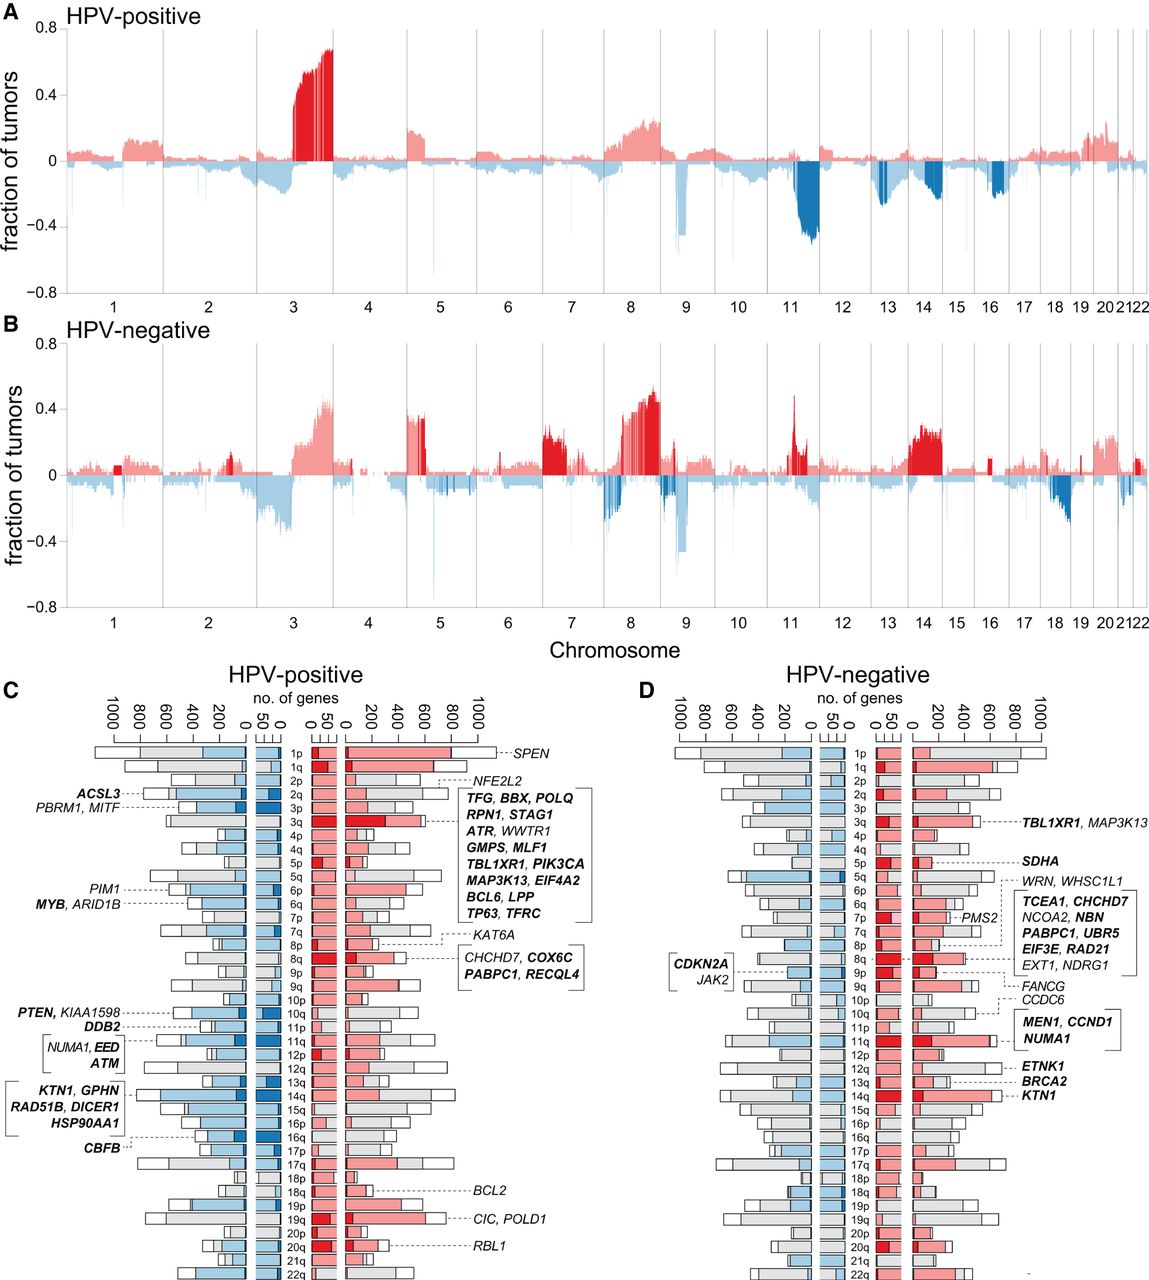
Recurrent chromosomal segment gains and losses in HPV-positive vs. HPV-negative OSCCs. Histograms show the cumulative fraction of samples with significant changes in genomic segment copy number gains (red) and losses (blue) for (A) 103 HPV-positive and (B) 50 HPV-negative OSCCs. Fractions of affected cancers (y-axis) were determined by summing up WGS samples with ploidy N < 1.5 (loss, blue, negative values) or N > 2.5 (gain, red, positive values), divided by the total number. x-axis, chromosomal coordinates Chr 1–22. Dark segments: genomic segments that were significantly enriched in either HPV-positive or in HPV-negative cancers, based on adjusted P < 0.01 using the proportion test to compare each 500-kb segment in the two types of samples. Sex chromosomes are not shown due to unreliable copy number calls. (C,D) Bar plots show the numbers of differentially expressed genes associated with copy number changes for each chromosome arm in (C) 101 HPV-positive OSCC and (D) 50 HPV-negative OSCC cancers. Insets: Listed are differentially expressed genes in CNV regions, already annotated as cancer-causing genes in Sanger Cancer Gene Census database and/or identified here as most highly mutated genes identified by MutSig. x-axis: numbers of genes; y-axis: chromosome arms. Each bar shows numbers of genes on each chromosome arm: (pink, red) in regions with copy number gains; (red) with increased expression that is significantly associated with local copy number gains, adjusted P-value < 0.05; (light blue, dark blue) in regions with copy number losses; (dark blue) with decreased expression that is significantly associated with local copy number losses, adjusted P-value < 0.05; (gray) lacking sufficient copy number changes; (white) with low variance of expression, so not tested. For each gene, the variance in gene expression was calculated for 101 HPV-positive and 50 HPV-negative cancers from batch-adjusted RNA-seq data. Differentially expressed, CNV genes were identified using the t-test to compare their expression in at least three samples with local copy number gain or loss vs. expression in samples with normal copy number at the gene (see also Supplemental Fig. S5; Supplemental Table S5).