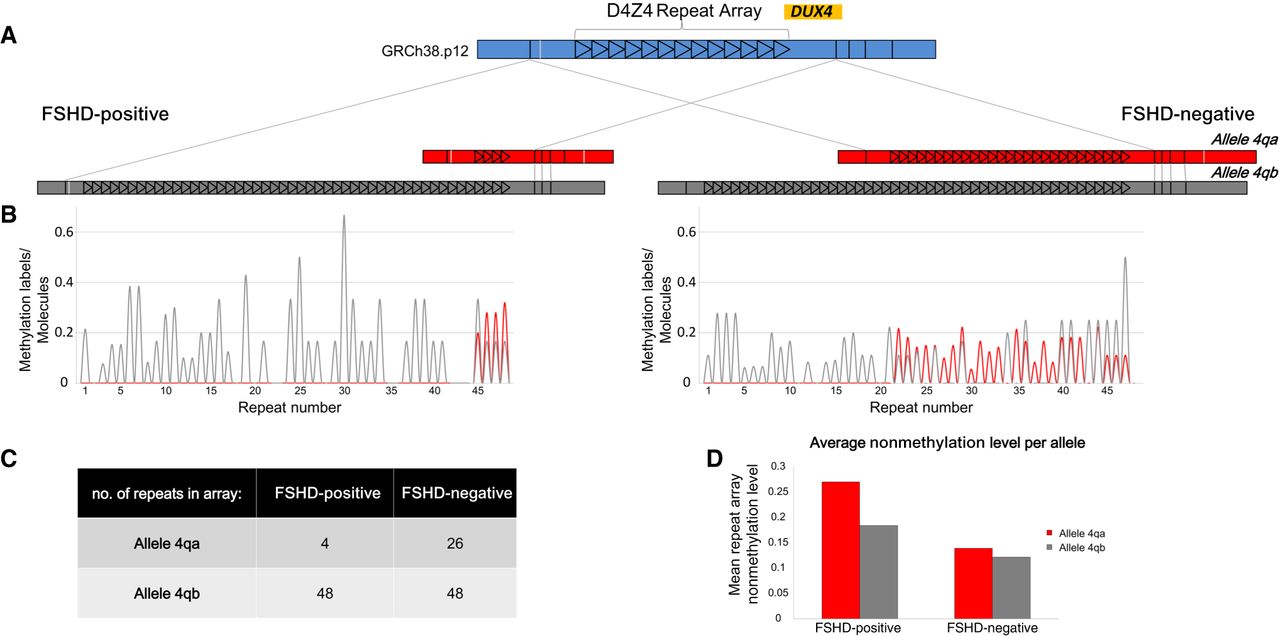
Copy number and methylation analysis of the pathogenic contraction on Chromosome arm 4q of an FSHD patient compared with a healthy individual. (A) De novo assembly consensus optical maps of the two alleles, 4qA (red) and 4qB (gray) for both samples. Alignment to the in silico–generated map of this region (blue) is indicated by gray lines. Each repeat is represented by a black triangle. (B) Average profiles of detected ROM methylation labels for the two individuals (red indicates 4qA; gray, 4qB). Each peak in the plot corresponds to the average nonmethylation level of one repeat unit. (C) Table summarizing the number of detected repeat units in each allele. (D) Bar plot displaying the mean ROM nonmethylation value in the complete repeat array in both alleles for both samples.