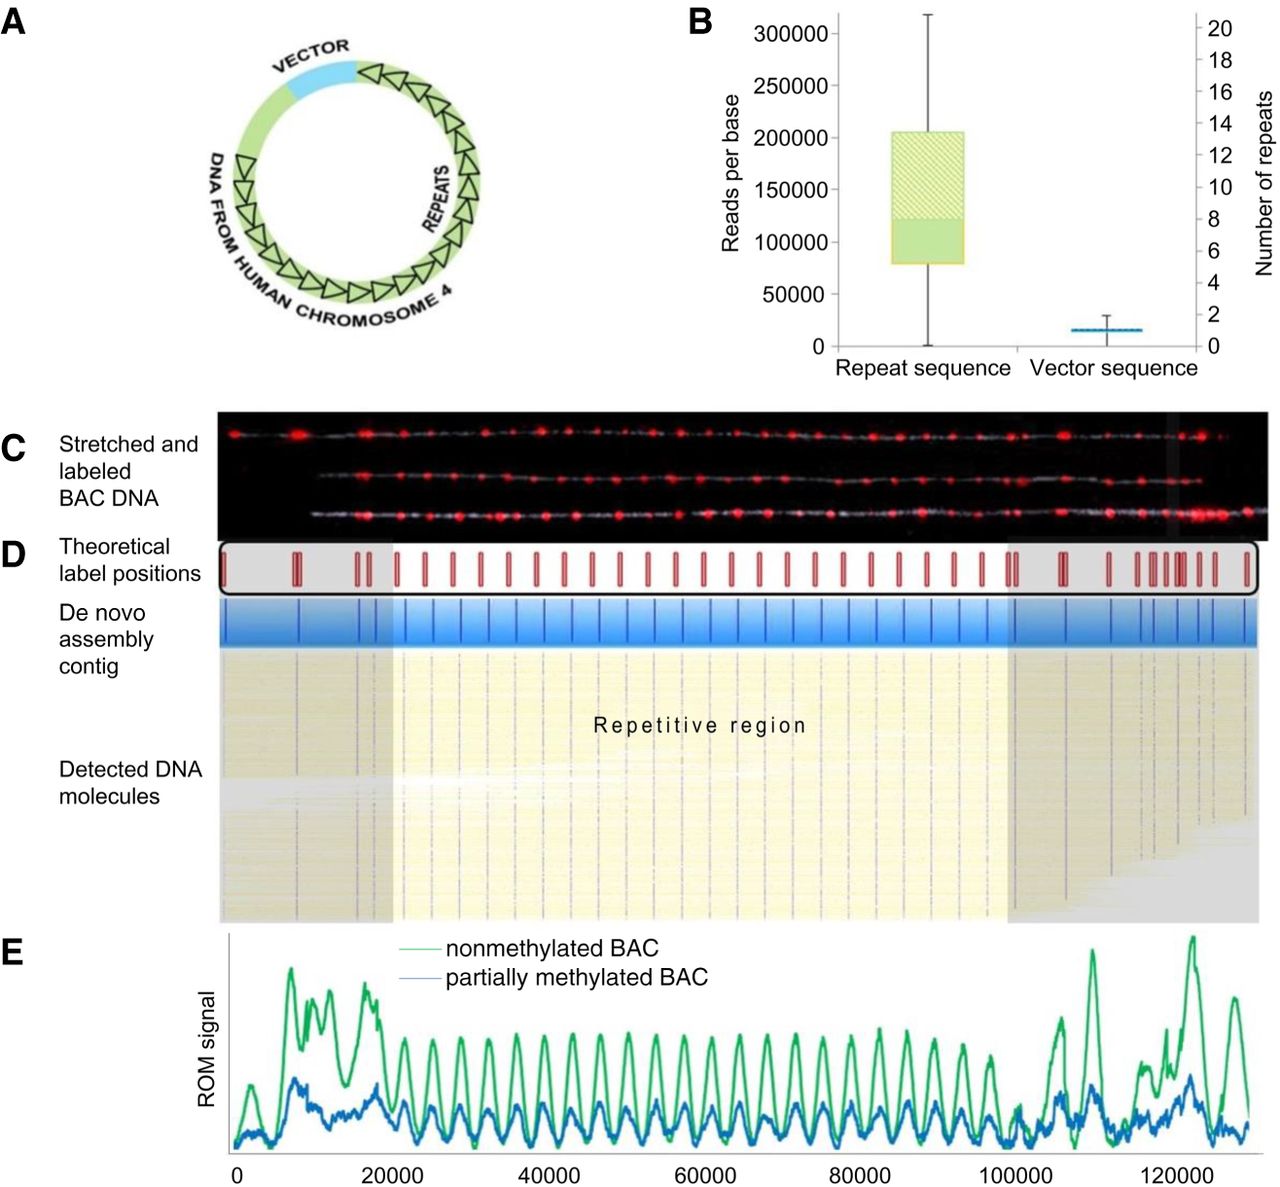
Copy number analysis. (A) The FSHD BAC model system contained a D4Z4 repeat array of unknown size (black triangles), genomic DNA upstream of the repeat array of unknown length (green), and the cloning vector (blue). (B) Box plots displaying the 25th, median, and 75th percentile (bottom, middle, and top of the box) of read coverage values along the repeat region (left box) and the nonrepetitive region (including the vector and the nonrepetitive genomic DNA; right box). The scale on the right is normalized to the median coverage along the nonrepetitive region. (C) Representative images of three intact model molecules labeled with Nb.BsmI (red dots) and stretched on modified glass surfaces. The labeling pattern can be aligned to the reference map presented below the images (expected labeling locations are shown in red). (D) Six hundred twenty-seven digital representations of labeled DNA molecules (yellow, blue dots represent detected labels) stretched and imaged in a nanochannel array chip. Consensus map of de novo assembly of the molecules is displayed in blue. The nonrepetitive regions are highlighted in gray (E) Comparative ROM profiles of nonmethylated and partially methylated BAC samples. Normalized averaged profiles of detected ROM labels are presented for the nonmethylated sample (green; 18,074 molecules) and partially methylated sample (blue; 9089 molecules). Each peak in the repetitive region corresponds to one repeat unit.