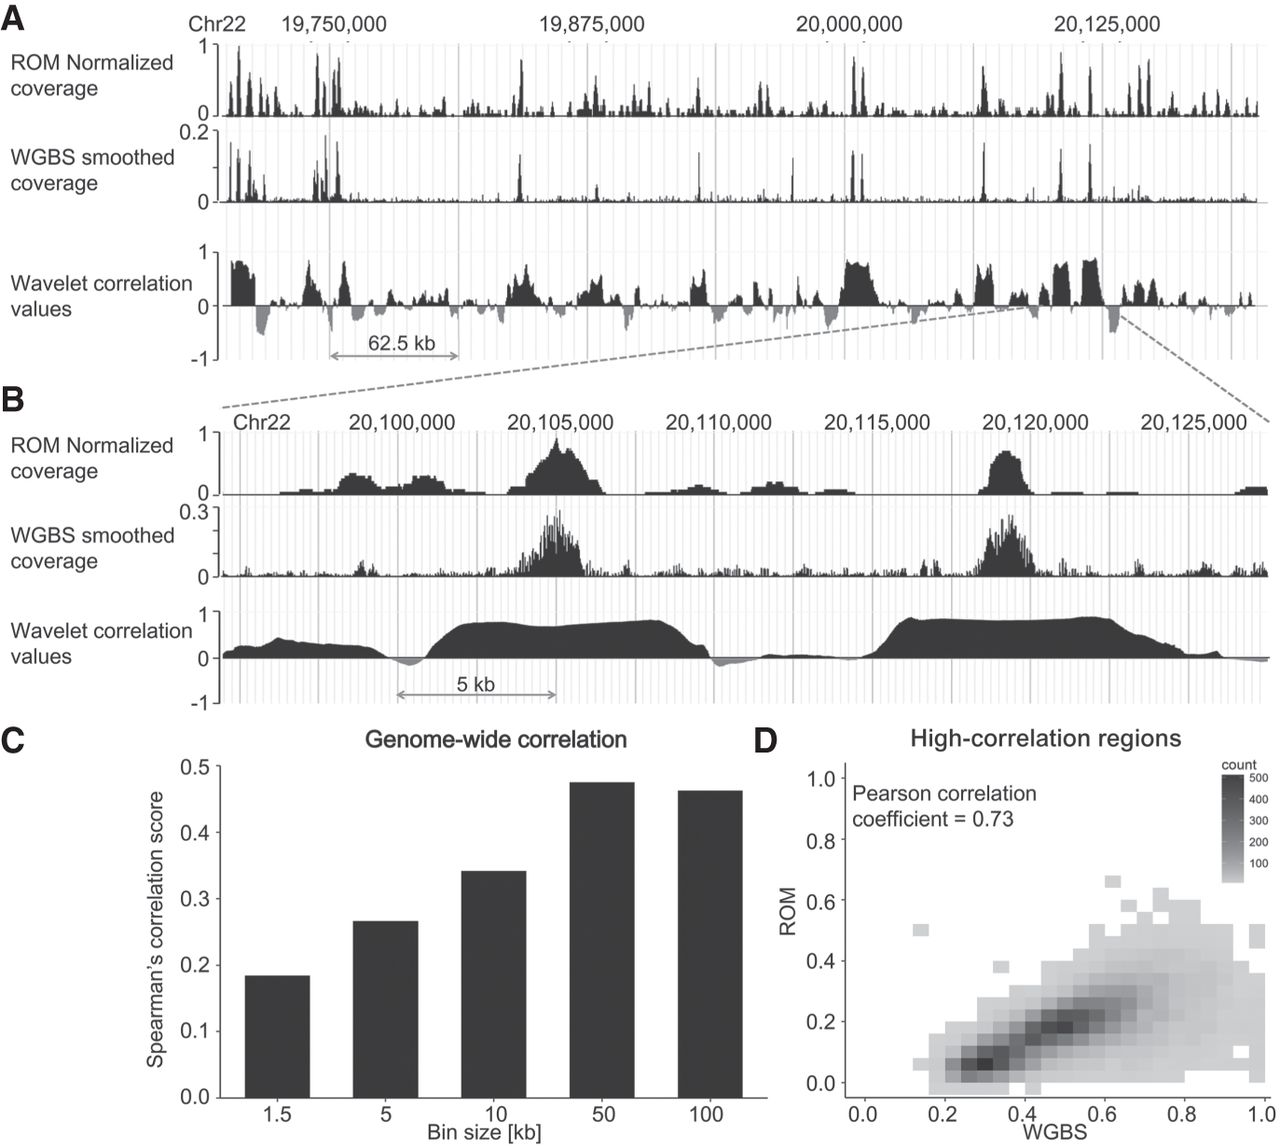
Figure 3.
Genome-wide correlation between WGBS and ROM. (A) Comparison of coverage produced by both methods in a representative 500-kbp region from Chromosome 22 and the locus-specific wavelet decomposition correlation values in 10-kbp windows centered at each genomic position. (B) A zoom-in on a 40-kbp region from the same locus. In both cases, the WGBS data shown were inverted to represent nonmethylation levels and were smoothed using the wavelet transform. (C) Spearman's rank-order correlation values for genome-wide comparison of ROM and WGBS in different window sizes. (D) 2D density plot of nonmethylation levels in ROM in WGBS for regions identified as highly correlated by wavelet decomposition analysis.