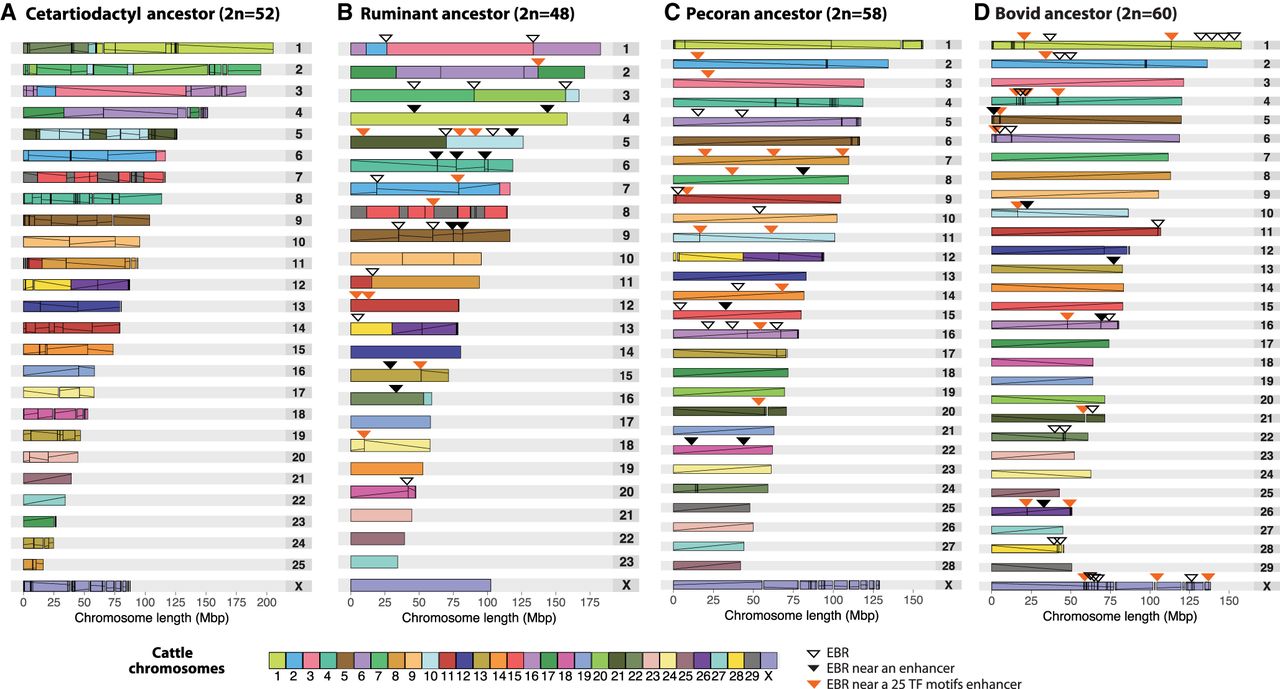
Figure 2.
Ideograms of the reconstructed ancestors relative to cattle chromosomes: (A) cetartiodactyl, (B) ruminant, (C) pecoran, (D) bovid. The vertical lines inside each chromosome reconstruction demarcate individual HSBs, whereas the diagonal lines indicate their orientation compared to the cattle genome. Arrowheads indicate evolutionary breakpoint regions (EBRs) associated with ruminant or cetartiodactyl enhancers (black), including the 25 TF motif enhancers (orange) and those not associated to any enhancers (white). Comparison of EBR positions with positions of enhancers is described in the “Functional constraint of enhancers” section.