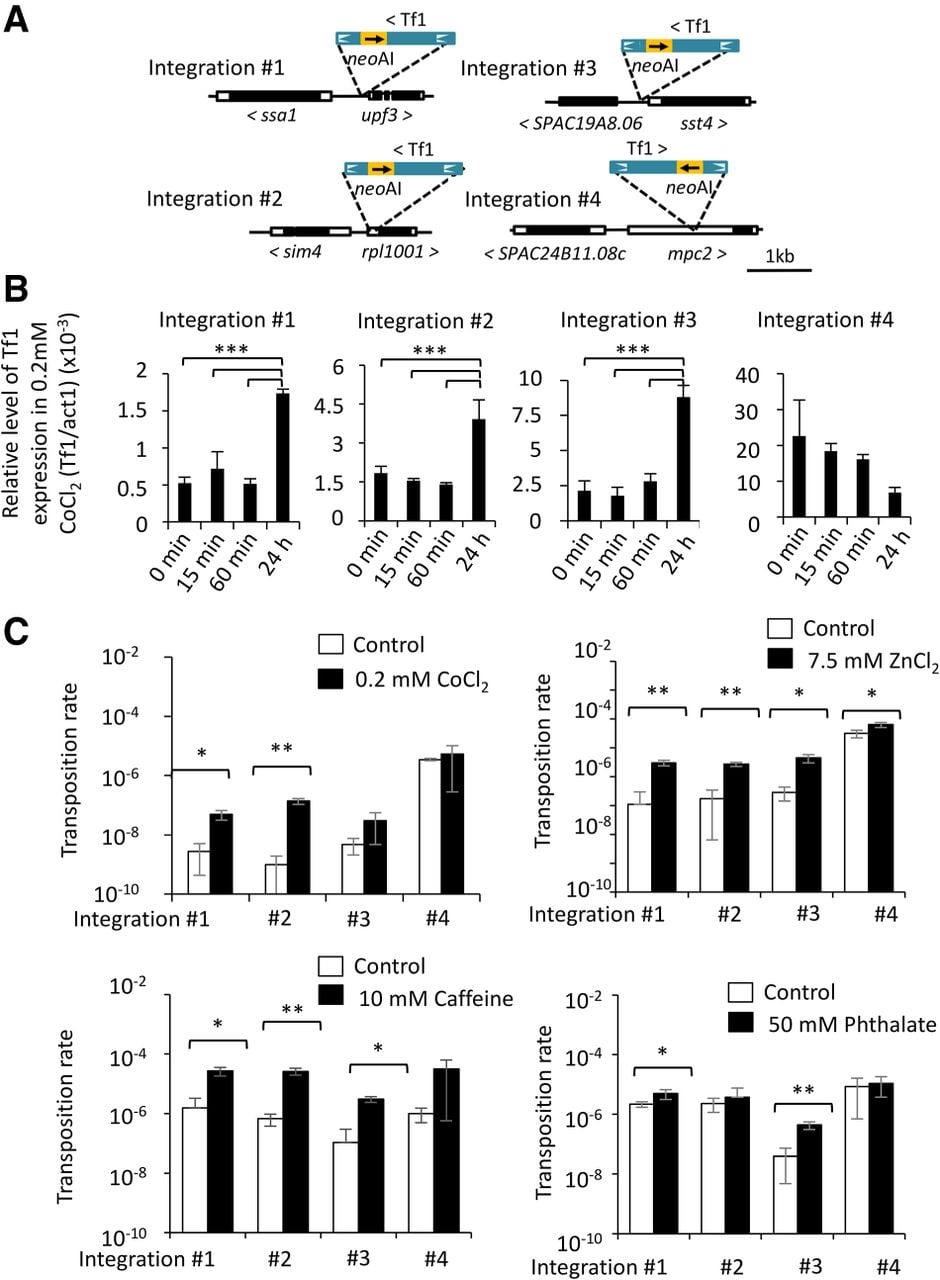
Figure 1.
Diverse forms of environmental stress induce Tf1 expression and transposition. (A) Tf1 integration sites generated in a previous study (Feng et al. 2013). For mobility assays, we added an artificial intron in neo (neoAI). White boxes indicate UTR; black boxes, ORF; line, intergenic region. (B) Relative level of Tf1 mRNA over time during exposure to CoCl2. (C) Tf1 transposition rate after exposure to CoCl2, ZnCl2, caffeine, and phthalate. Differences that are significant are indicated as follows: (*) P ≤ 0.05; (**) P ≤ 0.005; (***) P ≤ 0.0005.