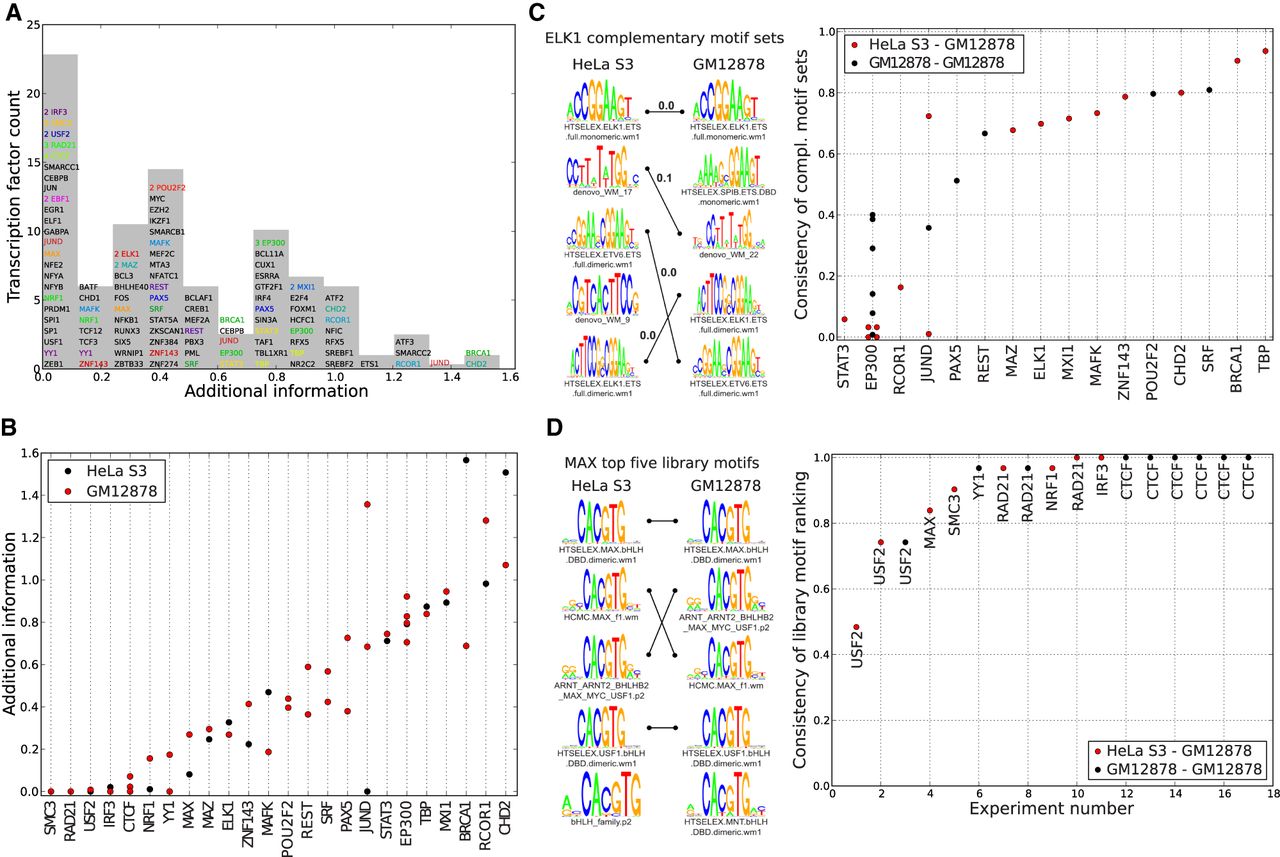
Consistency of the motif sets across replicate data sets. (A) Histogram of the additional information for all complementary motif sets from the ENCODE data. The height of the bin corresponds to the number of unique TFs in the bin. TFs with multiple experiments are shown in a colored font, and the multiplicity of experiments for one TF within a bin is indicated. (B) Additional information across replicates for the 24 TFs for which multiple experiments were performed. Each dot corresponds to an experiment, with the color indicating the cell line. TFs are sorted by their mean additional information. (C) Consistency scores for all pairs of experiments (dots) with cobinding TFs (columns). The color indicates whether the experiments were performed in the same (black) or different (red) cell lines. As an example, the logos on the left show the complementary motif sets for two ELK1 experiments in different cell lines, with matching motifs connected by lines. The consistency score for these two sets is 0.7 (see Methods). (D) Consistencies of the top five known motifs for all pairs of experiments (columns) with the same solitary binding TF (indicated next to each dot). The color indicates whether the pair of experiments was performed in the same (black) or different (red) cell lines. As an example, we show the top motifs for two experiments with the TF MAX, in two different cell lines. Identical motifs are connected by lines, and the consistency of these two sets of motifs is 0.84.