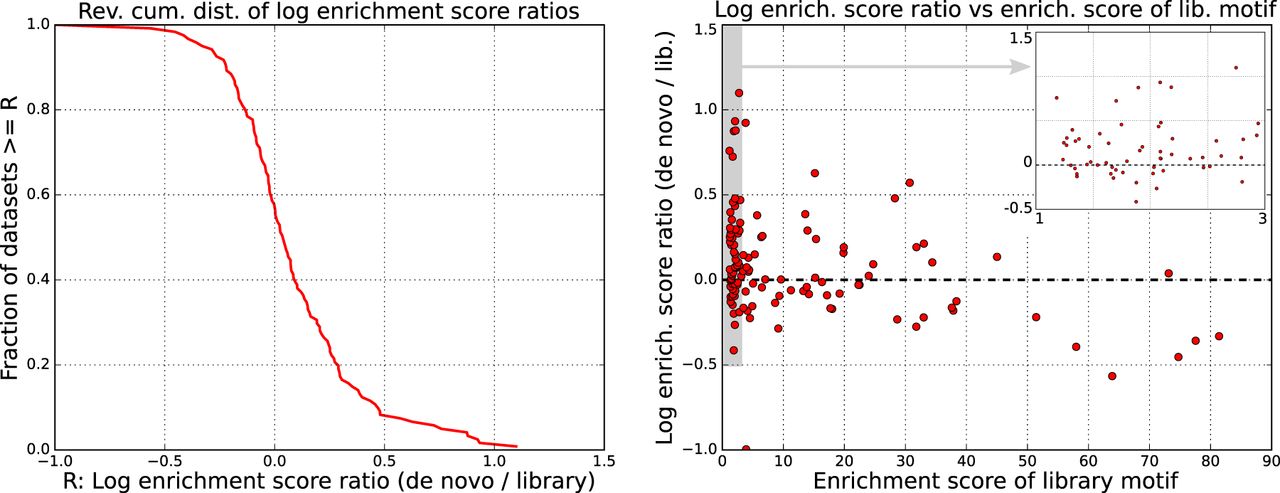
Figure 6.
Comparison of the performance of known and de novo motifs. (Left) The reverse cumulative distribution of the log-ratios R of enrichment of the top motif found de novo by Crunch and the top motif from the library of known motifs across the 121 ENCODE data sets for which at least 200 binding peaks were identified. A positive difference means that Crunch's de novo motif outperformed all library motifs. (Right) Scatter plot of the log-ratio R as a function of the enrichment score of the best-known motif. The inset zooms in on the gray region on the left side of the plot.