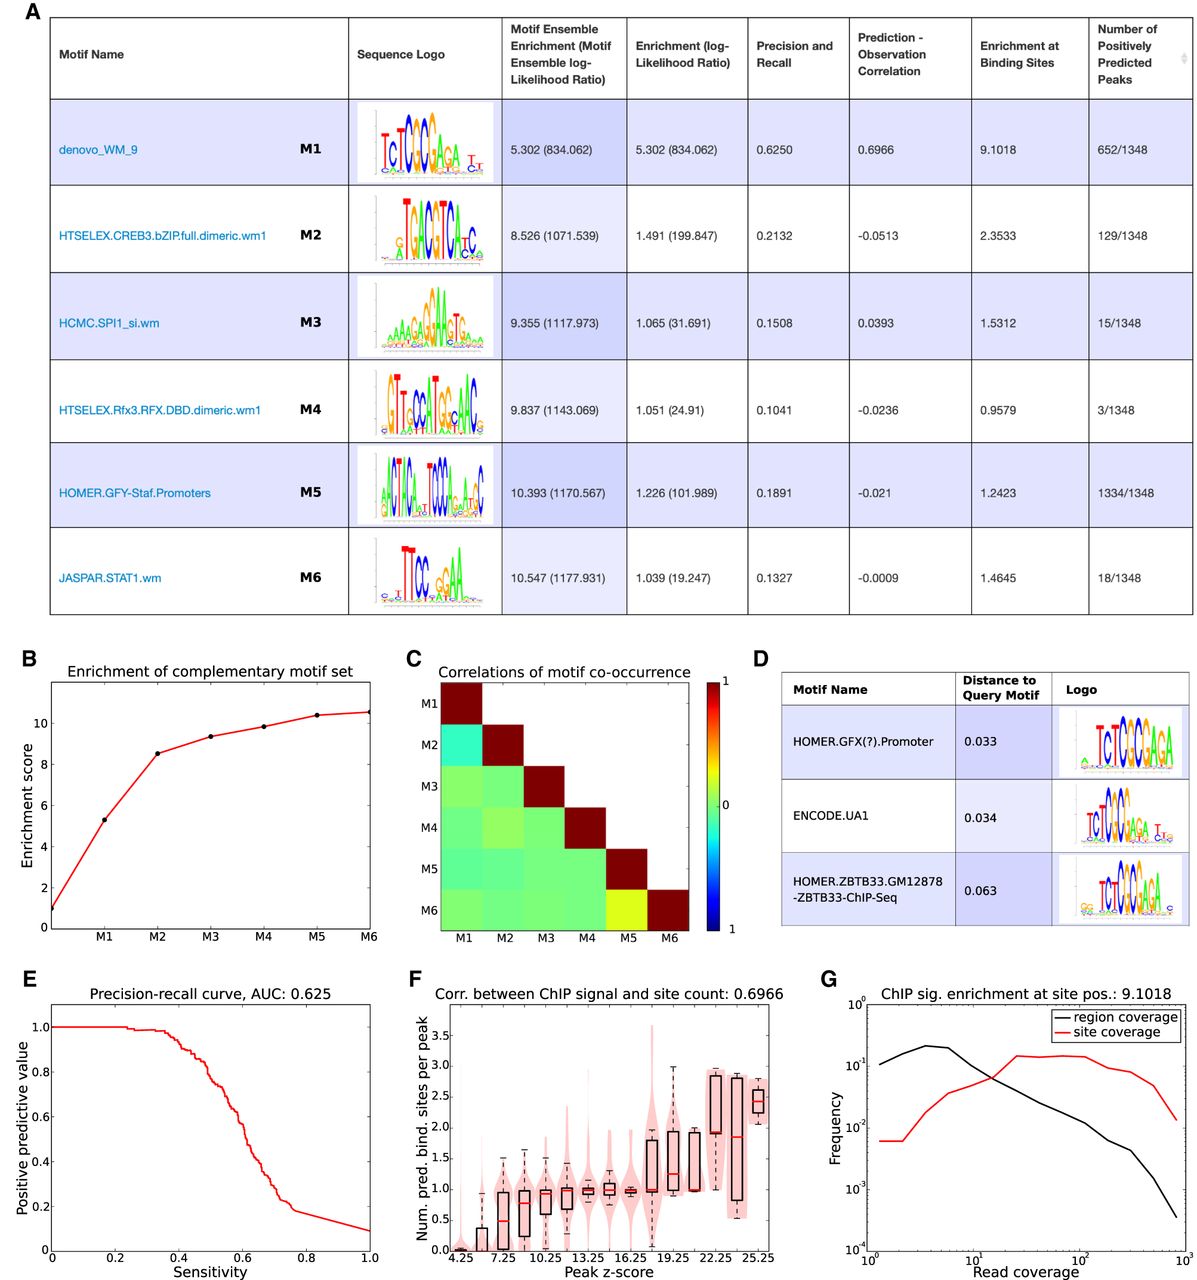
Motif analysis results for the BRCA1 data set. (A) List of complementary motifs that jointly explain the BRCA1 binding peaks. The motifs are sorted in the order in which they were added to the motif set, and for each motif, its name, sequence logo, and a set of statistics characterizing the performance of the motif are shown. (B) Evolution of the enrichment score of the ensemble of complementary motifs {w} as more motifs are added. (C) Heatmap of pairwise correlations of the occurrence of all motifs in {w} across binding peaks. (D) The top three motifs from the library of known motifs with most similarity to the motif denovo_WM_9. (E) Precision-recall curve for motif denovo_WM_9. The area under the curve (AUC) is 0.625. (F) Correlation between the ChIP signal (peak z-scores) and the number of predicted binding sites for denovo_WM_9 in peaks. The Pearson correlation coefficient is 0.6966. (G) Distributions of ChIP coverage at denovo_WM_9 sites (red curve) and at all positions in peaks (black curve). The coverage at sites is on average 9.1018, as high as at random positions in the peaks. Both axes are shown on a log-scale.