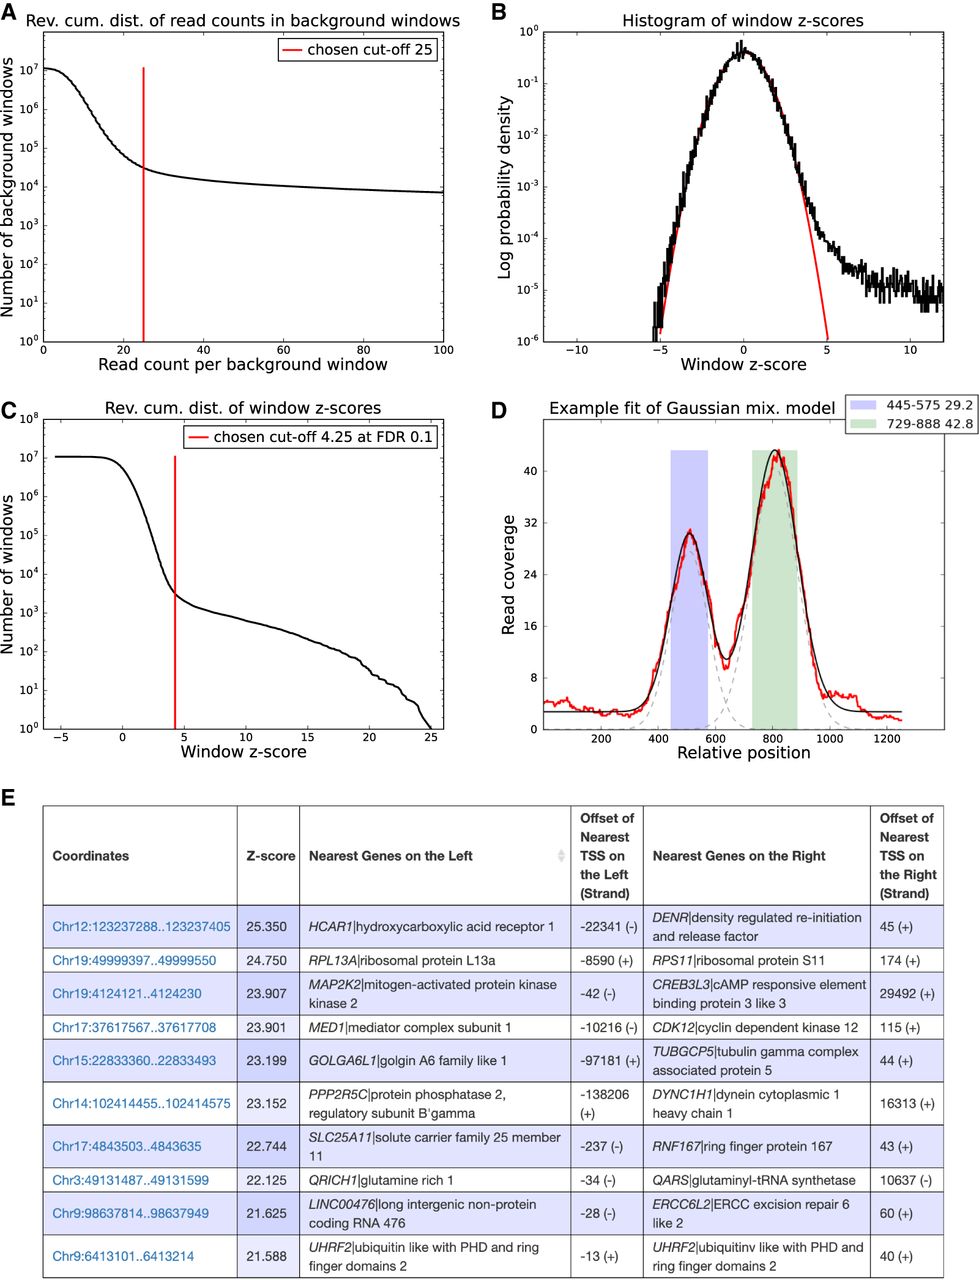
Peak calling results for the BRCA1 data set. (A) Reverse cumulative distribution of the summed read counts from the BRCA1 background samples in genome-wide sliding windows of 2000 bp. Crunch adaptively determines a cutoff (red line), and windows with coverage higher than this cutoff are removed from further analysis. (B) Distribution of the observed z-values from all genome-wide sliding widows (in black) and a reference standard normal distribution (in red). (C) Reverse cumulative distribution of the same z-values (in black), as well as the z-score threshold (in red) corresponding to an FDR of 0.1. Note that the vertical axes in panels A, B, and C are in log-scale. (D) ChIP read-density profile of an individual enriched region (red), together with the fitted mixture model (black). The two gray dashed lines show the Gaussians used in the mixture model of this region. The colored bars show the two individual binding peaks with their locations and amplitudes shown in the legend. (E) Table with the top 10 peaks of the BRCA1 experiment. Each peak is annotated with its coordinates on the genome, its z-value, its nearest upstream and downstream genes, and the distance to the transcription start sites (TSS) of these genes.