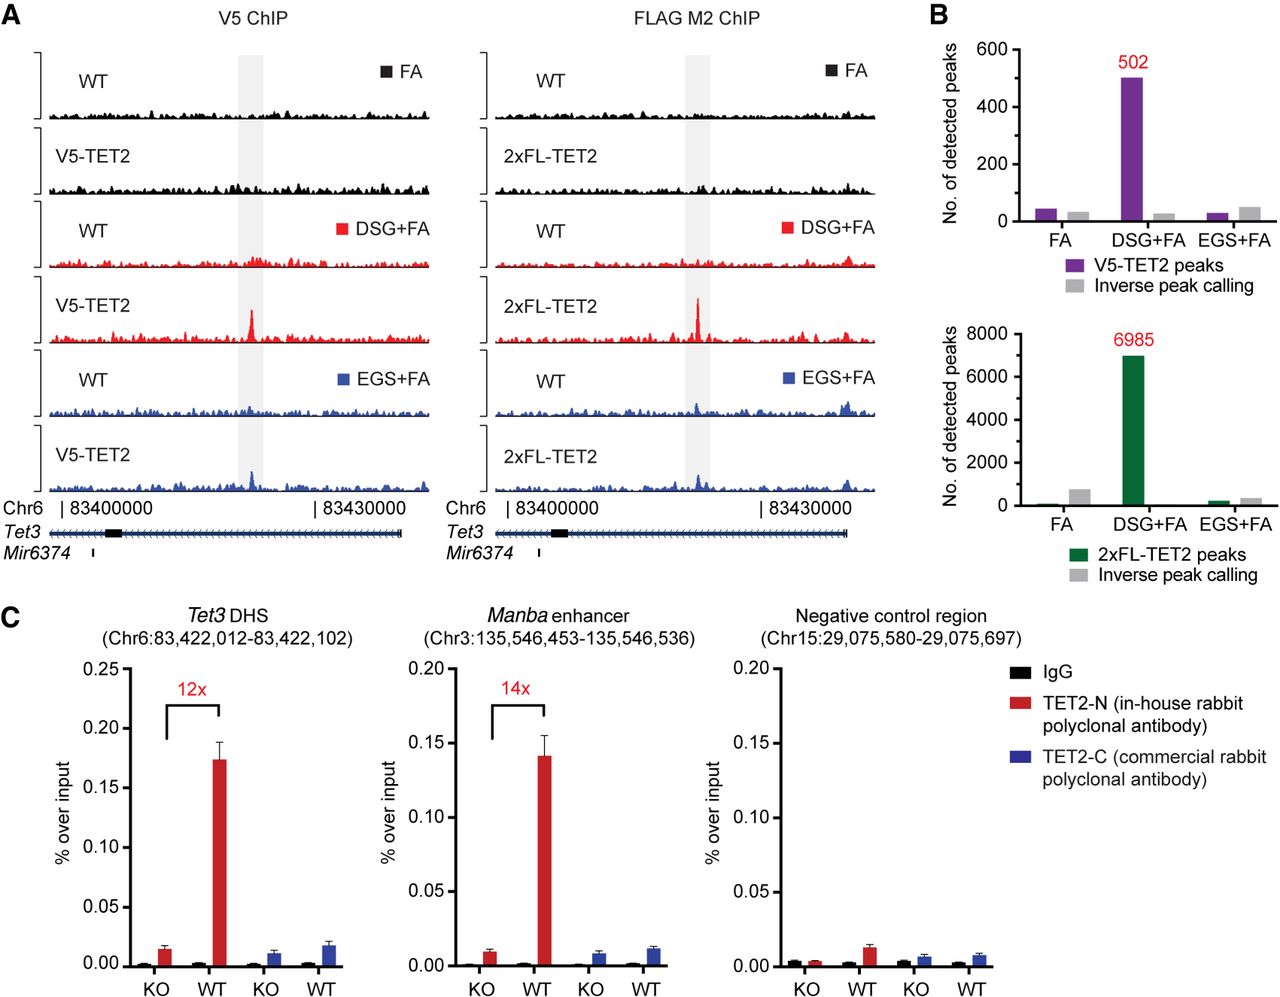
TET2 chromatin immunoprecipitation and sequencing on wild-type and epitope-tagged cell lines. (A) Representative ChIP-seq tracks of either V5 (left) or 2xFL (right) ChIP experiments in ES cells using different crosslinking conditions. (FA) formaldehyde; (DSG) disuccinimidyl glutarate; (EGS) ethylene glycol bis(succinimidyl succinate). (B) Histograms showing the number of called peaks in the different crosslinking conditions in V5-TET2 (upper) or 2xFL-TET2 (lower)-expressing cells compared to parental cells without endogenously tagged TET2. The number of peaks enriched in parental cells are also shown (inverse peak calling). (C) ChIP-qPCR for TET2 binding in ES cells using antibodies raised against endogenous TET2. Two positive regions (an intronic DNase I hypersensitivity site in Tet3 and an enhancer region in the Manba gene) as well as a negative control region are shown. Data are presented as mean enrichment over input with error bars depicting technical triplicates. The average fold enrichment over Tet2 knockout control cells is indicated.