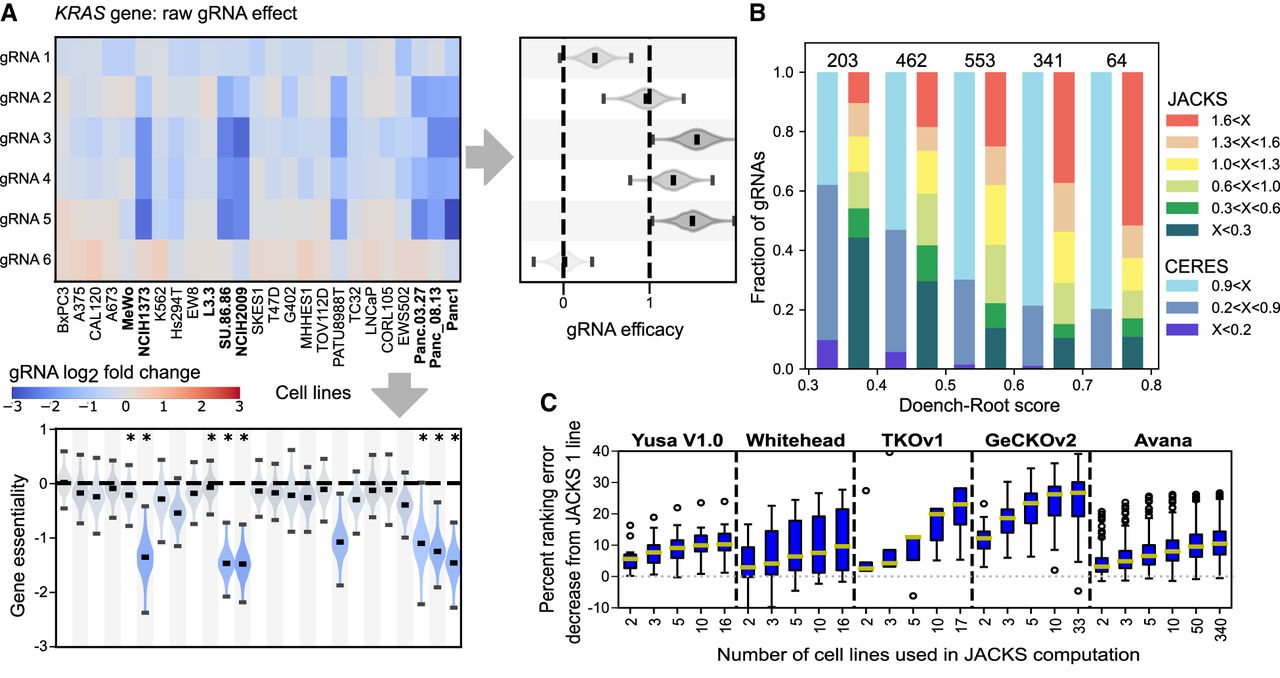
Joint analysis of several CRISPR/Cas9 knockout screens. (A) JACKS inferred decomposition of median-normalized log2 fold change (heatmap) for six gRNAs targeting the KRAS gene (y-axis, GeCKOv2 library) in 25 cancer cell lines from Aguirre et al. (2016) (x-axis). The inferred gRNA efficacies and gene essentialities (with uncertainty) are displayed to the right and below the heatmap, respectively. Lines with KRAS driver mutations are highlighted in bold and indicated with an asterisk. (B) Fraction of gRNAs (y-axis) targeting Hart essential genes (Hart et al. 2014) in each range of Doench–Root score (Doench et al. 2016) (x-axis) for specified ranges of CERES and JACKS inferred gRNA efficacy scores (“X”; colors). Number of gRNAs in each column is marked above the bar. (C) Percentage of ranking error (fraction of area above the ROC curve below 0.2 false-positive rate; Methods) decrease (y-axis; median, quartiles, and 95th deciles marked in box plot) for increasing number of experiments in JACKS model (x-axis) for five different libraries.