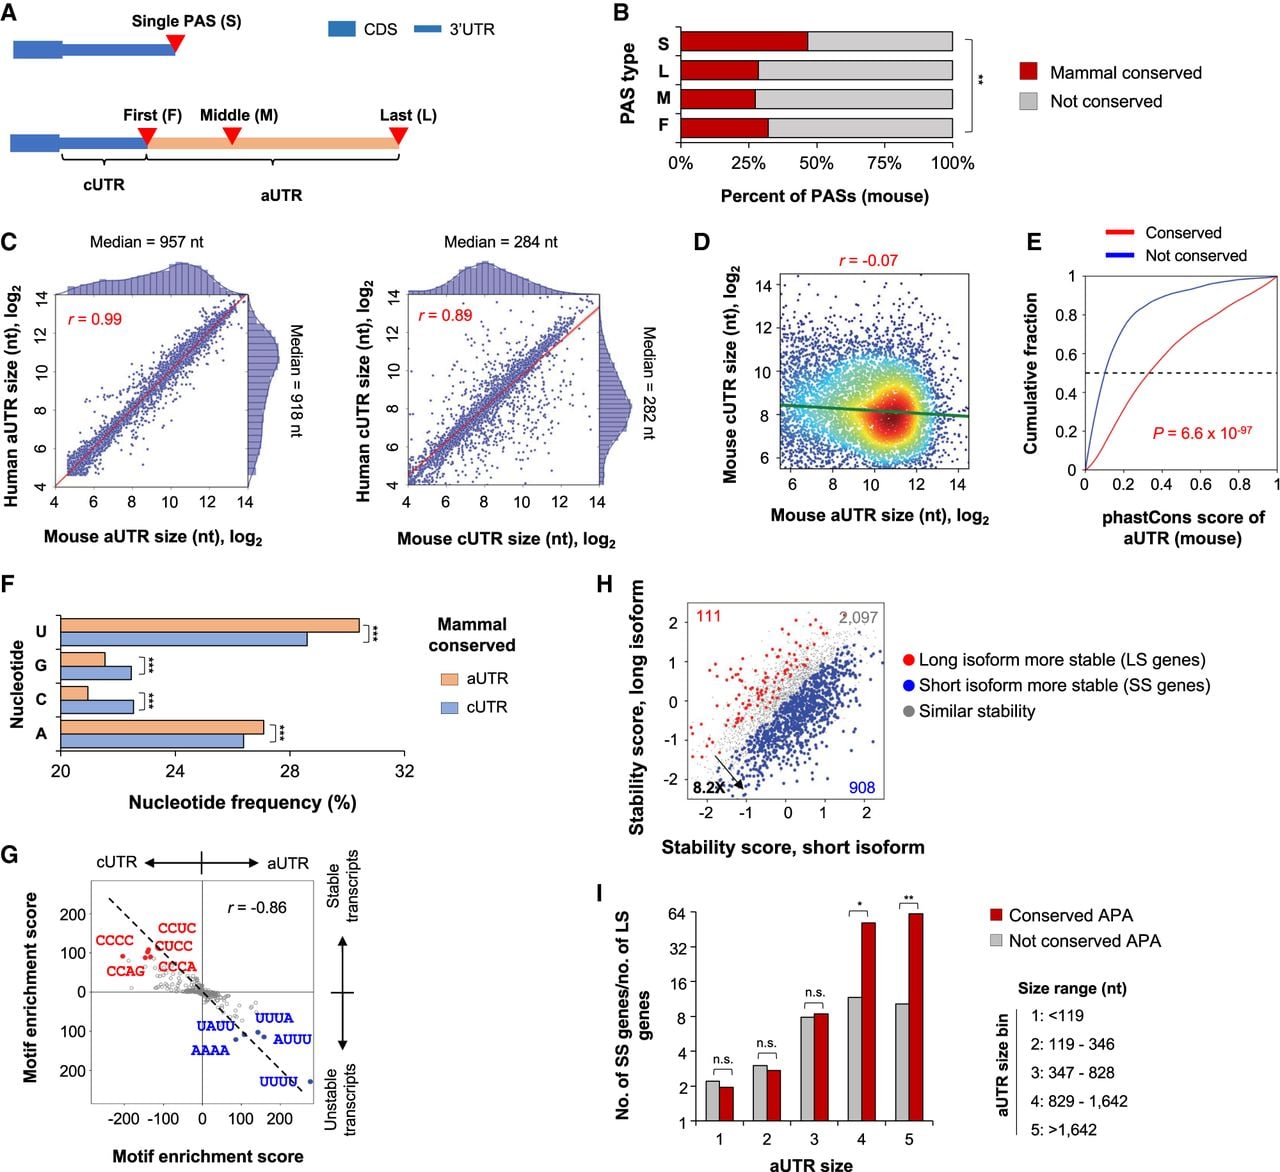
Conserved aUTRs. (A) Different types of PASs in the 3′ UTR: (S) single; (F) first; (M) middle; (L) last. As indicated, the region before the first PAS in a 3′ UTR is named common UTR (cUTR), and the region after is alternative UTR (aUTR). (B) Conservation of different types of 3′ UTR PASs: (**) P < 0.01 (χ2 test). (C) Correlation of aUTR length (left) or cUTR length (right) between human and mouse genes. A total of 6706 orthologous genes with conserved 3′ UTR APA are included. 3′ UTRs are divided into aUTRs and cUTRs using the first conserved and last conserved PASs (mammal conserved). Median length value for each species and Pearson correlation coefficient are indicated. (D) Comparison of conserved cUTR size and aUTR size of mouse genes. Pearson correlation coefficient is indicated. (E) Cumulative Distribution Fraction (CDF) curves of phastCons scores of conserved aUTRs versus nonconserved aUTRs. Nonconserved aUTRs are those between the first and last 3′ UTR PASs from genes without any mammal-conserved 3′ UTR PASs. (F) Nucleotide frequencies of conserved aUTRs and cUTRs (mouse sequences): (***) P < 0.001 (χ2 test). (G) Comparison of tetramers enriched in aUTRs versus cUTRs (x-axis) and those enriched for stable versus unstable transcripts in NIH3T3 cells (y-axis). Enrichment score is based on Fisher's exact test (Methods). Pearson correlation coefficient (r) is shown. Top enriched tetramers are indicated. (H) Comparison of mRNA stability between proximal PAS and distal PAS isoforms in NIH3T3 cells. Stability score is based on log2(ratio) of preexisting RNA to newly made RNA (Methods). SS genes (short 3′ UTR isoform significantly more stable than long 3′ UTR isoform) and LS genes (long 3′ UTR isoform significantly more stable than short 3′ UTR isoform) are highlighted. Significance is based on two replicates (Methods). (I) Ratio of gene number (SS genes versus LS genes) versus aUTR size. Genes are divided into five groups based on the aUTR size (range indicated): (*) P < 0.05; (**) P < 0.01; (n.s.) not significant (χ2 test).